Fundamental
Overview
The S&P 500
has been rallying almost non-stop since the FOMC meeting, and thanks to the
miss in the NFP report and the benign CPI
report the price eventually hit a new all-time high yesterday. We are currently
seeing a bit of a pullback, which is totally normal after such a strong run.
The US
jobless claims yesterday could have weighed on the risk sentiment if they were
worse than the prior reading, but instead, we got another positive release
which should keep the bullish momentum going.
S&P 500
Futures Technical Analysis – Daily Timeframe
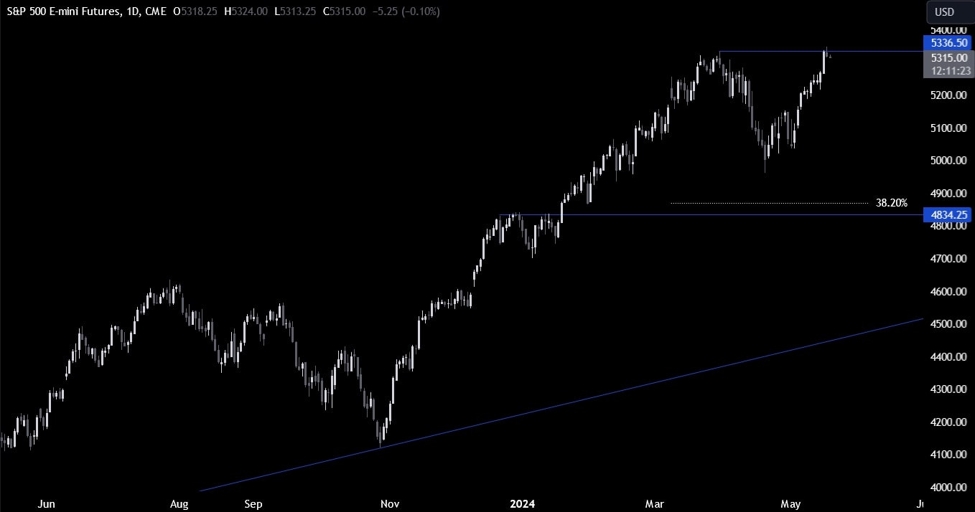
S&P 500 Futures Daily
On the daily
chart, we can see that the S&P 500 hit a new all-time high yesterday and
pulled back a bit soon after. The correction into the 4835 support
is unlikely at the moment as we would need a strong deterioration in the growth
and jobs data to reverse the bullish trend.
We can expect the
buyers to pile in more aggressively if we break above the 5336 level. The
sellers, on the other hand, might step in around these levels with a defined
risk above the high to position for the correction into the 4835 level,
although that looks unlikely at the moment.
S&P 500 Futures
Technical Analysis – 4 hour Timeframe
S&P 500 Futures 4 hour
On the 4 hour
chart, we can see that we have a good support zone around the 5300 level where
we can find the confluence
of the trendline
and the 38.2% Fibonacci
retracement level. Technical buyers might lean on the trendline to position
for a rally into new highs with a better risk to reward setup. The sellers, on
the other hand, will want to see the price breaking lower to position for a
drop into the 5217 swing level.
S&P 500
Futures Technical Analysis – 1 hour Timeframe
S&P 500 Futures 1 hour
On the 1 hour
chart, we can see that we have a minor resistance zone around the 5325 level
where the price got rejected a couple of times since yesterday. A break above
the zone should see the buyers piling in with more conviction and target a new
high.
The sellers, on
the other hand, might lean on it to position for the continuation of the
pullback into the trendline with a better risk to reward setup. The two red
lines indicate the top and bottom of the average
daily range. This is how much the market could move on any given day
barring strong catalysts.
Upcoming
Catalysts
We don’t have anything
on the calendar for today, so the market will likely consolidate into the
weekend.