monsitj
Goldilocks data propelled the S&P500 (SPY) to a high of 5655 on Friday before the second sharp reversal of the week. Tops are often made on good news rather than bad, and these reversals were particularly interesting given the level and circumstances. 5638 was highlighted as major target in my article of June 16th.
The next major level comes from the 1.618* expansion of the 2021-2022 bear market and is way up at 5638. I don’t know if it will be reached on this phase of the rally, but this is probably the ultimate goal at some stage.
Combined with exhaustion signals in the higher timeframes, the odds of a significant reversal are higher than usual. That said, this trend has been unique in many ways and technical signals can fail. It is therefore important to keep assessing the behaviour of any decline and adjusting expectations. It could well be yet another bullish dip.
This week’s article looks closely at how a reversal could develop and how to identify if it is a dip in the uptrend or the start of a major correction. Various techniques will be applied to multiple timeframes in a top-down process which also considers the major market drivers. The aim is to provide an actionable guide with directional bias, important levels, and expectations for future price action.
S&P 500 Monthly
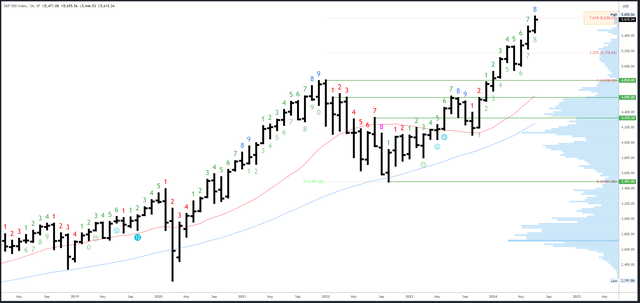
Statistically, the first half of July is the best performing two-week period of the year and it didn’t disappoint this year. The odds of a positive close in July are high but that leaves plenty scope for several large price swings in the next two weeks ahead of a close above 5471.
The June high of 5523 is the first level of any note on the downside; a drop back in the June range at this stage would be potentially bearish.
The 1.618* expansion of the 2021-2022 bear market is at 5638 and I would expect a reaction in this area as it is the most significant extension level on the chart. 5754 is the next potential target where there is a measured move.
Support comes in at the July low of 5446 and the 5265 area.
July is bar 8 (of a possible 9) in an upside Demark exhaustion count. These counts can have an effect from bar 8 onwards, so a reaction could be seen this month.
S&P 500 Weekly
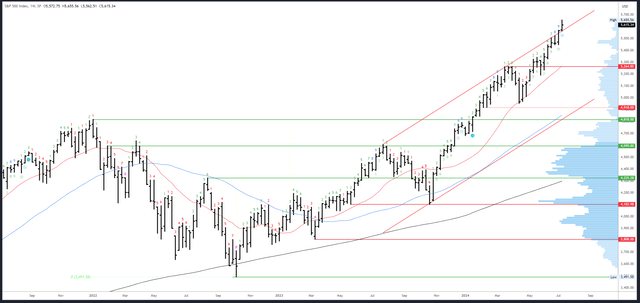
This week’s bar was bullish, although Friday’s sell off into the close shifted it slightly into neutral territory. As such, it doesn’t project immediate follow through next week.
Looking back at previous peaks in March, July last year and even January last year, none of them came from a solid weekly reversal pattern. Indeed, they came from weekly bars very like this week’s pattern. This simply tells us a reversal can happen despite the apparent bullishness. A break through this week’s low of 5562 would support a bearish shift.
The weekly high of 5655 is the only resistance.
This week’s low of 5562 is initial support, followed by the 5440 area. 5265 is a major level, but should not be tested if this rally is to stay strong.
A weekly Demark exhaustion signal has now completed, and this is a red flag, especially combined with the monthly exhaustion now in play. Looking back at previous 3 signals, we can see a reaction either on bar 9, or 2 weeks following the completion of bar 9. The warning is clear: the last two corrections of >5% happened soon after weekly exhaustion signals.
S&P 500 Daily
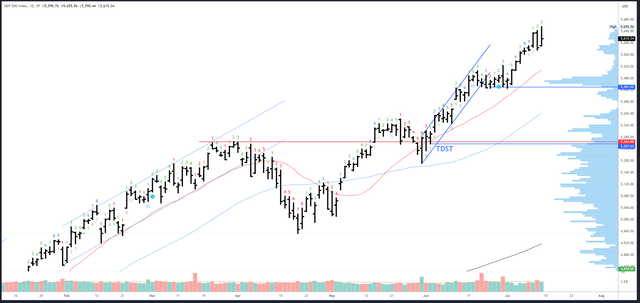
It was an erratic end to the week. Thursday’s “sell the news” was predictable enough, but Friday’s recovery and reversal into the close less so. I still think we should see a pullback next week, but I would be a lot more confident if Friday’s session had closed lower.
Resistance comes from the weekly and monthly references.
On the downside, Thursday’s 5576 low is initial support, with the weekly level of 5562 just below. A break of this area should unwind the last rally to the high volume area around 5470. 5440-51 is now major support. The 20dma is at 5508 and rising, so could be in play on the next dip.
An upside Demark exhaustion count completed on Tuesday but completely failed as Wednesday’s buyers correctly “guessed” CPI would be positive. No new signals can complete next week.
Drivers/Events
Powell’s Semi-Annual Monetary Policy Report before the Senate Banking Committee set up the CPI release perfectly. “More good data would strengthen our confidence that inflation is moving sustainably toward 2%,” he said, just two days before more good data. CPI actually fell in June. This was the final nail in the coffin for the “higher for longer” narrative and the odds for a September cut are now around 93.8%.
Unemployment Claims came out at the same time as CPI and showed a drop from +239K to +222K. This was important as it means the Fed can claim cuts are a response to beating inflation rather than a reaction to a slowing economy.
Thursday’s perfect data produced some odd market moves. Small caps outperformed large caps by 4.5%, the second largest outperformance on record. Notably, the -2.2% decline in the Nasdaq (QQQ) and the -0.88% drop in the S&P500 came when 80% of NYSE stocks advanced. It turns out improving breadth can be a negative for the S&P500.
Next week’s data is on the light side. Retail Sales data is due out on Wednesday and Unemployment Claims are on Thursday. Now that a September cut is all but guaranteed, bulls will want to see strong data. As I said last week, “A September cut has always been likely as long as inflation moderates and we don’t really need to see the economic data unravelling as well.”
Probable Moves Next Week(s)
Bigger picture, H2 is very likely to close higher, as is July. However, these are quite vague expectations and there is scope for all sorts of moves in the meantime.
Due to the major Fib level at 5638, the multiple exhaustion signals, the “sell the news” action and the complete pricing in of September cut, I do think the S&P500 is ripe for a major reversal. However, the erratic price action at the end of the week has not provided any firm signal, yet. This can form next week with a drop through 5562 into a weak close. We can then look for should the last rally to unwind back to 5470.
With a higher July close (i.e. above 5471) very probable, dips into 5470 are likely a buying opportunity, at least short-term, with 5440-51 acting as major support. It’s too early to say whether this leads to further highs or rolls over into a large correction to the 5000 area. Given the conditions, there is a decent chance of the latter in Q3, but the route there all depends on whether the uptrend holds the key area of 5400-5450.


