Fundamental
Overview
Yesterday, the US
ISM Manufacturing PMI missed forecasts although it wasn’t such a big miss
as it was still in the range of estimates, but it was nonetheless a miss and the market reacted accordingly. I’d
say that one bad report amid a series of good ones shouldn’t be enough for a
change in the trend, especially considering that the final reading of the S&P Global US Manufacturing PMI released a bit earlier showed an even greater improvement. The ISM report though, should set aside the inflation fears
which should be good news for the stock market as long as we don’t have more worrying data on the growth side.
S&P 500
Technical Analysis – Daily Timeframe
S&P 500 Daily
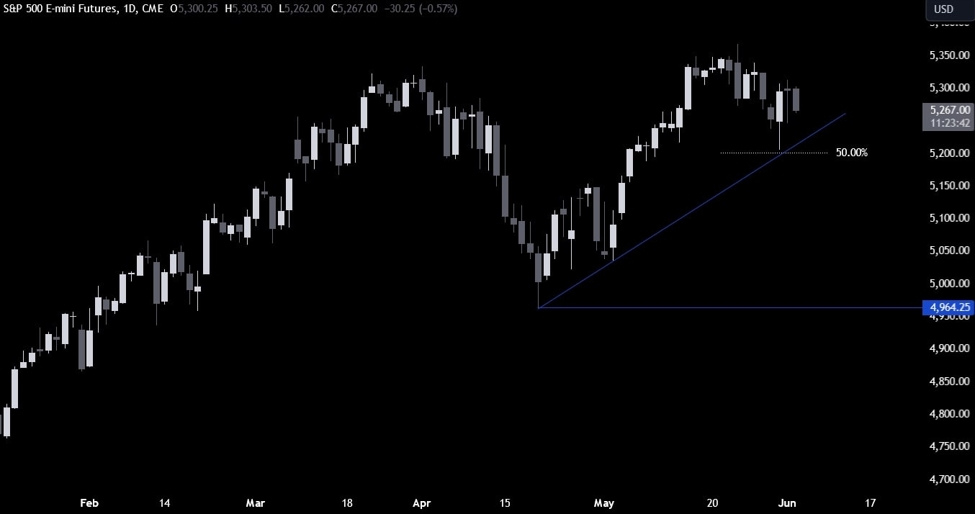
On the daily chart, we can
see that the S&P 500 bounced recently around the 5200 level where we had
the confluence
of the trendline
and the 50% Fibonacci
retracement level. That’s where the buyers piled in on the last day of the
month fading the weakness from the month-end flows. The sellers will need the
price to break below the trendline to turn the bias more bearish and start
targeting a drop into the 5000 level.
S&P 500 Technical
Analysis – 4 hour Timeframe
S&P 500 4 hour
On the 4 hour chart, we can
see that the price recently probed above the downward counter-trendline but
couldn’t really extend the rally into new highs. The 5313 level will be the
spot to watch as a break above it should see the buyers increasing the bullish
bets into a new all-time high. The sellers, on the other hand, should wait for
a break below the major trendline to get a bit more conviction for a correction
lower.
S&P 500 Technical
Analysis – 1 hour Timeframe
S&P 500 1 hour
On the 1 hour chart, we can
see more clearly the recent price action with the S&P 500 now consolidating
between the major trendline and the 5312 level. There isn’t much to do in the
middle of this “range” as the erratic moves could give false signals. If we get
another drop into the major trendline though, some late buyers could take it as
an opportunity to step in with a better risk to reward setup. The red lines
define the average daily range for today.
Upcoming
Catalysts
Today we have the US Job Openings data. Tomorrow, we have the US ADP and the
US ISM Services PMI. On Thursday, we get the latest US Jobless Claims figures,
while on Friday we conclude the week with the US NFP report.