Kowit Lanchu/iStock via Getty Images![]()
“You have to know the past to understand the present.” -Carl Sagan.
In the early 1900s the British Royal Navy was by far the most powerful fleet in the world. In addition to protecting the British Isles from invasion, the Royal Navy’s greater purpose was the protection of trade. Britain relied upon imports, and its economic prosperity depended on seaborne commerce. Any threat to Britain’s naval supremacy threatened the nation itself.
During this period Britain viewed Germany as the main threat to its empire, as Germany’s leader, Kaiser Wilhelm II, pursued a policy of building a rival naval fleet. In 1906, this maritime race focused on constructing a new class of battleship developed in Britain – the dreadnought. These huge ships, designed for the firepower of heavy guns and powered by steam turbines, made all earlier warships obsolete. In both countries, demand grew for dreadnoughts. Germany eventually realized that it could not match the Royal Navy in the short term and, in 1910 redirected much of its defense budget to the army. However, the damage to Germany’s relationship with Britain proved lasting.
By 1914, Europe was divided into two rival coalitions. German unification in 1871 radically transformed the balance of power in Europe. This new power bloc in central Europe strengthened in 1879 when Germany allied with neighboring Austria-Hungary. Italy joined three years later, forming the “Triple Alliance.” Fear of Germany’s growing strength encouraged Russia and France to ally in 1893. Although Britain had long seen France and Russia as potential enemies, in 1904 Britain sought to secure its empire and negotiated agreements with both countries. Britain’s new and unlikely friendships heightened Germany’s historical fears of encirclement and the divide between the European powers grew.
Britain’s share of world trade declined between 1880 and 1913 from thirty-eight percent to thirty percent, while Germany’s share increased during the same period from seventeen percent to twenty-six percent. Between 1890 and 1913, German exports tripled and surpassed Britain, driving its portion of world manufacturing to fifteen percent. By 1913, American and German exports had dominated the world steel market, dropping Britain to third place. In 1914, German steel output was 17.6 million tons, larger than the combined output of Britain, France, and Russia. Germany’s coal production reached 277 million tons in 1914, approaching Britain’s 292 million tons but far ahead of France’s 40 million tons and Russia’s 36 million tons.1
The economic conflict started long before the actual fighting in August 1914, but the first World War was expensive for Britain. Post-war unemployment, trade, and a huge national debt significantly reduced Britain’s economic output throughout the 1920s. World War I was a long, brutal, and expensive conflict and Britain suffered 715,000 military deaths along with more than twice that number wounded. Approximately 5.5% of its human capital and over 25% of its GDP was lost in the war effort.
More than any other major country, Britain’s position in the world economy before World War I depended on globalization. World War I brought the liberal economic order of the late 19th century to an abrupt halt.2 Japan and the United States replaced Britain in international markets during the war, while Britain suffered a permanent loss of world market share.3 The volume of British exports in the mid-1920s was only 75% of its 1913 level. Not surprisingly, the war required massive borrowing, resulting in high inflation and a significant increase in the national debt. By 1920, the British national debt was 1.3 times the GDP compared with 0.25 times the GDP in 1913.4
Historically, empires built infrastructure to import cheap commodities, transform them into higher value-added goods, and pushed them back out to the rest of their empire. Just as Britain operated under this economic model before World War I, China is trying to replicate this practice as a land-based empire. By contrast, the United States has enjoyed naval control of the world’s oceans for the last seventy-five years. During the 1950s and the 1960s, the United States leveraged this dominance by transforming cheap commodities into high value finished goods and worldwide exportation.
The United States may still dominate the seas, but one wonders if it is still an industrial empire. Global unrest in Europe and the Middle East painfully brings this question to light. Ukraine cannot maintain an adequate supply of 155-millimeter artillery shells simply because allies cannot produce them in sufficient quantities. The U.S. no longer maintains the workforce, the raw materials, or the factories to create the munitions it easily produced at a significant scale during World War II. And a small group of antagonists with a drone can now threaten naval might, as entire sea lanes are shut due to the Houthis aggressive activities in the Red Sea. As the global balance of power is changing, profound shifts are underway that suggest a vastly different world.
The relationship between the U.S. and China is rapidly evolving. The United States is actively trying to prevent China’s military rise, a strategy that escalates kinetic tensions is Asia. Just as Great Britain’s relationship with Germany changed with the ascension of Kaiser Wilhelm II, the U.S. relationship with China changed with the arrival of Xi Jinping in 2012. Previously, China was an inexpensive manufacturing center, allowing the U.S. to capture disproportionate profit margin through innovative marketing and sales “Designed in the USA.”
Under Xi Jinping’s leadership, China now assumes a more imperial direction with the “One Belt, One Road” initiative and the Silk Road Fund. Historically, Chinese leadership focused solely on internal problems. Xi Jinping redirected this focus to building roads in Africa, constructing ports in the Middle East, and securing global commodity inputs. America perceives a growing threat to its unipolar position when Xi Jinping promotes “China 2025,” China’s desire to design, produce, and export its own commercial airplanes, cars, tractors, and sophisticated communications equipment. China wants to move up the value chain and compete globally, altering the global order that existed for decades. The United States, like Great Britain, seeks to nullify the threat to its economic hegemony.
The global economic order, once regarded as immutable, is now rapidly changing, affecting every facet of life and spanning the arc of history. Between 1907 and 1922, horses went from providing 95% of all private vehicle miles traveled on American roads to less than 20%. Transportation disruption was sudden in urban areas like New York City, which quickly adopted the automobile. Because cars travel far more per year than horse-drawn wagons, mass-produced automobiles quickly sealed the horse’s fate as a form of transport for a fraction of the cost per mile.5 When change occurs, it can be both sudden and violent.
The disruption of horses by automobiles in the early 20th Century followed a typical pattern throughout history. The adoption of the new technology exploded while the older technology collapsed. Just as dreadnought battleships rendered all earlier naval ships obsolete and internal combustion engines disrupted transportation by horses, a convergence of technologies will soon provide humanoid robots with the capability to disrupt human labor. Humanoid robots will work more hours per week than a person, in any condition, without vacation, illness, or complaint. At first, humanoid robots will only perform simple tasks, but their capabilities will quickly grow. David Goldman of the Asia Times noted with concern that the United States is not investing in industrial equipment. China, by comparison, is installing more industrial robots than the rest of the world combined.6

The transition from a fundamentally deflationary world to an inflationary one is also disruptive. Nearly four decades of lower interest rates and deflationary pressures have calcified investment perspectives. In a deflationary world, bonds are the natural diversification for a portfolio, but in an inflationary world, portfolio construction is different. When inflation is persistent, energy and precious metals are the natural portfolio diversifiers. Current U.S. fiscal and monetary policies strongly support the transition to an inflationary world. The U.S. has just experienced three consecutive years with inflation above 3%, yet the U.S. Federal Reserve, the country’s central bank, expresses little concern.
Today, the U.S. runs a budget deficit approaching seven percent of the country’s economic output (‘GDP’) at a time of full employment. Such a large deficit has historically followed a global war or economic depression. French economist Jacques Rueff was French President Charles de Gaulle’s advisor in the 1960s. Rueff often stated that “inflation consists of subsidizing expenditures that give no returns with money that does not exist.” One sees this behavior everywhere-creating new money not backed by actual economic activity. Whether one calls it green energy, defense spending, or social spending, there are significant increases in government spending with few visible benefits. China has also massively increased its debt and government spending, but this debt has funded infrastructure growth-railways, dams, highways, shipping ports, and airports-not unlike the U.S. before the 1960s.
A significant amount of the U.S. federal debt is unproductive; it does little to enhance the economy’s productive capacity. Most government programs are wasteful, with insufficient efforts to direct spending to practical uses. Federal spending has reached a level where no one knows where much of it goes, and it is increasingly evident that America’s quality of life is not improving due to this excessive borrowing. Thirty years ago, the U.S. government had $4 trillion in debt. It now has $35 trillion in debt, growing by $2 trillion annually.
The U.S. has experienced a massive increase in debt to fund expenditures that give no return. Economists will argue differently, but this is the very definition of inflation. It is delusional to ignore, as inflation has not fallen in a single month since January 2021. Overall prices are up over 19.5% in less than four years, effectively wiping out one-fifth of the U.S. dollar’s purchasing power. We have not had a year-over-year inflation figure print below 3% in thirty-seven consecutive months.7 Inflation is now building on previous years of inflation, effectively compounding inflation.
Jim Grant, editor of Grant’s Interest Rate Observer, notes that inflation is inherent in our politics, culture, and finances. “Voters do not object because they get what they want.” Trouble starts with the very definition of inflation. “Too much money chasing too few goods” is the standard response, but it suggests only one cause of inflation: money. Grant cites the definition put forth by Wilhelm Röpke, a 20th-century German economist, as the most all-encompassing description; “Inflation is the way in which a national economy reacts to a continuous overstraining of its capacity, to demands which are extravagant and insistent, to a tendency towards excess in every and all circles.” Röpke’s definition allows for multiple causes of inflation: fiscal, monetary, political, and cultural.
Today’s world is drowning in government-created liquidity in the form of debt that is inflating the value of financial assets beyond their ability to generate the income necessary to support these multiples. There is no sign that governments will stop generating this liquidity until something breaks. Investors feel they must choose between buying overvalued indices or acting defensively by hiding in U.S. Treasury Bills that offer yields close to the government-reported inflation rate. Although it is unknown when or if markets will break, current valuations render expensive equities highly vulnerable to negative news. The reality is that markets depend on an unprecedented and unsustainable pile of debt, something investors should consider when reviewing the risks within their portfolios rather than chasing stocks promoting links to artificial intelligence.
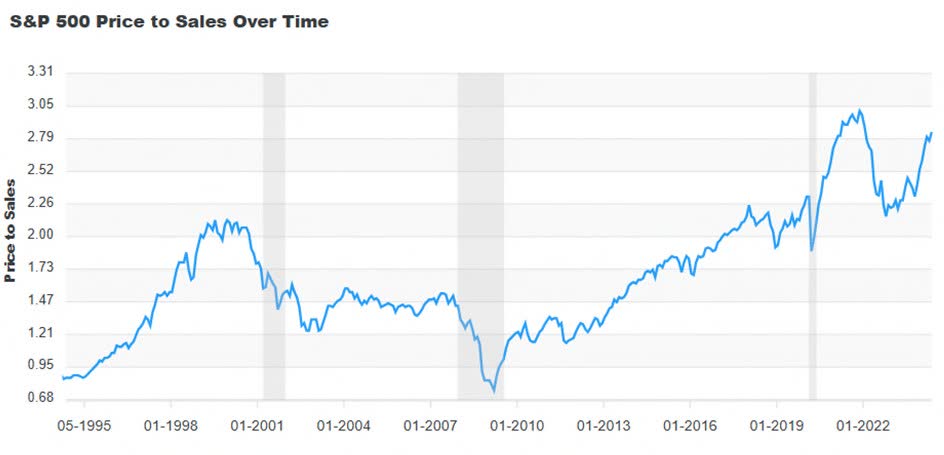
The S&P 500 index (SP500, SPX) has enjoyed an average annual nominal total return of 7.3% since 2000. John Hussman, an economist and fund manager, deconstructs this 7.3% annual return into 4.3% from nominal revenue growth, an average dividend yield of 1.9%, and an additional 1.1% annually, fueled by an expensively valued market growing even more expensive. In the 2000 internet bubble, the S&P 500 price-to-revenue valuation multiple reached the extreme level of 2.2. Today, this revenue multiple sits at an even more excessive level of 2.8. Assuming continued nominal revenue growth of 4.3% annually and adding the current S&P 500 dividend yield of 1.4%, a “permanently high plateau” in valuations implies estimated long-term expected S&P 500 nominal total returns of about 5.7% annually. At today’s valuation extremes, one can only wonder how much passive inflows and the expectation of long-term stock market returns rely on ever-higher valuation multiples without considering the possibility of a painful mean reversion.
A recent article in the Financial Times summarized the market’s current investment theme: “Don’t overthink it.”8 Many professional fund managers will only privately admit their investment thesis-the market wants to go up; therefore, do not overthink it. Such a mindset reeks of complacency. Matt King of Satori Insights urges caution. “The trouble with momentum-driven markets is that momentum and FOMO [fear of missing out] is often all that is driving them. That may still suffice to trump all other considerations and inflict considerable pain on anyone daring to try a value- or fundamental-driven short, but it nevertheless creates an underlying fragility.” But as many argue correctly, so far the market only wants to go up, so why fight it?
Bloomberg’s U.S. equity momentum factor model (composed of names that have outperformed the broader benchmark over the past year) accounts for two-thirds of the S&P 500’s year-to-date gains, generating its best performance in twenty years. Wall Street professionals are positioned accordingly, as net exposure to this momentum factor strategy sits at a two-decade high. Adding to this year’s fervor, the Financial Times reports that penny stocks represented seven of the ten most actively traded U.S. equities in May. Stocks trading at less than $1 account for over 14% of the market’s trading volume. Interactive Brokers chief market strategist Steve Sosnick noted, “It’s people willing to put fundamentals aside and chase returns.”
Peter Bernstein was a financial historian, economist, and one of the country’s best-known authorities on presenting investment economics to the public. A few years before he died in 2009, he told the story of a client for whom he managed money in the 1950s. The client, a doctor, enjoyed giving away money to his daughters. The client was fortunate because an extended bull market was underway at the time. Whatever he gave away, the market appreciated more than replaced. The client considered the exercise riskless because his generosity appeared to be a cost-free endeavor.9
Whenever they met, the client thanked Bernstein for making him whole after his most recent round of gifts. Bernstein always reminded the client that his gratitude was misplaced; “Don’t thank me. Thank all those nice people willing to pay higher prices today for the stocks you bought earlier at lower prices.” This client assumed that the steady growth of his money would continue indefinitely without risk.
For most of human history, the weather was the primary source of economic risk. With the Industrial Revolution, more goods and services came to market, economic complexity grew, and risks multiplied. Risk has shifted from a bet on nature to an elaborate series of bets on what other players in the economy will decide and how each will respond to the decisions of others. Risk today depends upon the consequences of others, not on what God or nature will provide.
Risk management means protecting oneself from the adverse and unexpected decisions of others. Berstein’s client acted as if his portfolio was immune from the adverse choices of other market participants. Seventy years later, investors maintain the same mindset. Asset prices move in response to countless investors’ buying and selling decisions, constantly considering the likely choices of others. Over the past thirty-two trading days, the collective actions of ‘others’ have led to a gain of over $1 trillion in market value for Nvidia, the dominant supplier of artificial intelligence hardware and software. To put this into perspective, the six-week gain exceeds the total market value of Berkshire Hathaway (BRK.A, BRK.B), which Warren Buffett has spent six decades building.10
Mr. Buffett is once again content to sit this market episode out, just as he famously did twenty-five years ago. “I don’t mind at all, under current conditions, building the cash position. I think when I look at the alternative of what’s available in the equity markets, and I look at the composition of what’s going on in the world, we find it quite attractive,” he recently told attendees at Berkshire Hathaway’s annual shareholder meeting. Buffett knows that the greatest virtue of a cash position is what it enables one to do once the adverse choices of other participants begin to violently impact the markets. For Warren Buffett, market corrections are welcome conditions.
“What is past is prologue,” Shakespeare wrote in The Tempest, as history sets the context for the present. When surveying today’s market valuations and sentiment, it is obvious that markets resemble the bull market peaks of 1929, 1968, 1999, 2007, and 2021 more than the bear market bottoms of 1937, 1974, 1982, 2003, and 2009. Knowing the past helps one understand an investor’s present prospects.
The prudent investor sees conditions that resemble prior periods when peak profit margins were accompanied by peak valuation multiples-circumstances characterized by investment euphoria and minimal margin of safety. Recognizing these conditions is not a forecast, as the broad market indices may continue to rise on the backs of a few dominant technology companies. However, history implies that better risk / reward opportunities exist outside the momentum factor strategies driving today’s valuation extremes.
With kind regards,
St. James Investment Company
|
Footnotes 1Kennedy, Paul (1989). The Rise and Fall of the Great Powers. London: Fontana, p 271. 2Findlay, R and O’Rourke, K (2007), Power and Plenty. Princeton: Princeton University Press. 3Cochrane, S J (2009), “Britain’s Position in the World Economy: Increasing Returns and International Disruption, 1870-1939”, unpublished D. Phil. Thesis, University of Oxford. 4Mitchell, B R (1988), British Historical Statistics. Cambridge: Cambridge University Press. 5https://www.rethinkx.com/blog/rethinkx/the-disruption-of-labour-by-humanoid-robots 6https://x.com/davidpgoldman/status/1786943392133325097 7https://x.com/KobeissiLetter/status/1791097366155571563 8Martin, Katie. Financial Times. Opinion: The Long View. May 24, 2024. 9Bernstein, Peter. “Crazy Little Thing Called Risk.” The New York Times. November 18, 2007. 10https://x.com/jessefelder/status/1798415445999173809 St. James Investment Company We founded the St. James Investment Company in 1999, managing wealth from our family and friends in the hamlet of St. James. We are privileged that our neighbors and friends have trusted us to invest alongside our capital for twenty years. The St. James Investment Company is an independent, fee-only, SEC- registered investment Advisory firm that provides customized portfolio management to individuals, retirement plans, and private companies. DISCLAIMER Information contained herein has been obtained from reliable sources but is not necessarily complete, and accuracy is not guaranteed. Any securities mentioned in this issue should not be construed as investment or trading recommendations specifically for you. You must consult your advisor for investment or trading advice. St. James Investment Company and one or more affiliated persons may have positions in the securities or sectors recommended in this newsletter. They may, therefore, have a conflict of interest in making the recommendation herein. Registration as an Investment Advisor does not imply a certain level of skill or training. To our clients: please notify us if your financial situation, investment objectives, or risk tolerance changes. All clients receive a statement from their respective custodian on, at minimum, a quarterly basis. If you are not receiving statements from your custodian, please notify us. As a client of St. James, you may request a copy of our ADV Part 2A (“The Brochure”) and Form CRS. A copy of this material is also available on our website at www.stjic.com. Additionally, you may access publicly available information about St. James through the Investment Adviser Public Disclosure website at www.adviserinfo.sec.gov. If you have any questions, please contact us at 214-484-7250 or [email protected]. |
Editor’s Note: The summary bullets for this article were chosen by Seeking Alpha editors.