On-chain data shows some indicators related to the stablecoin supply have set new all-time highs recently, a sign that may be bullish for Bitcoin.
Stablecoin Supply-Related Metrics Have Continued Their Uptrend Recently
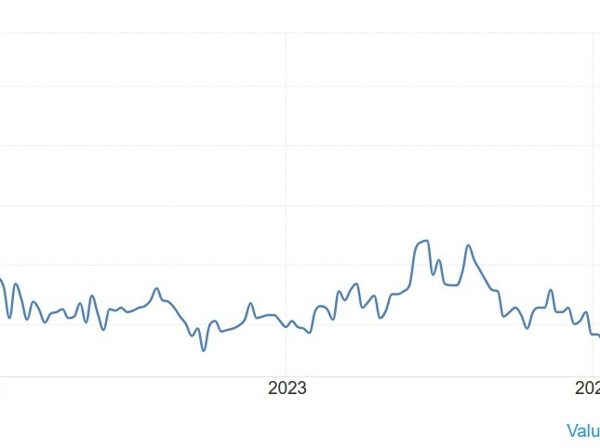
As pointed out by an analyst in a CryptoQuant Quicktake post, some stablecoin supply-related indicators have been showing an increase recently. The metrics in question are the total stablecoin circulating supply, the Tether (USDT) supply, and the total stablecoin exchange reserve on Binance.
Note that these indicators only include the data for the ERC20 versions of the stablecoins. Below is the chart for the metrics shared by the quant.

All of these indicators appear to have been on the rise in recent days | Source: CryptoQuant
The graph shows that all three metrics have moved upward recently and set new records. Thus, it appears that demand for stablecoins has been high among the investors.
While they may not initially appear important, stablecoins have been very relevant for the wider market historically. At their core, stablecoins serve as a sort of safe-haven for investors to store their capital, away from the volatility of Bitcoin and other assets.
However, holders who keep their capital like this eventually plan to venture out into the volatile side, as they would have chosen fiat instead if staying away from the market in the long-term was their goal.
Naturally, when investors make this swap to coins like Bitcoin, they provide a buying boost to their prices. Because of the potential to be deployed into the volatile side, the supply of the stablecoins is often considered the available “dry powder” in the market.
Thus, whenever the supply of these stables goes up, it can be a bullish sign for Bitcoin and other cryptocurrencies, as it suggests that there is now more capital waiting on the sidelines.
The recent increase in the stablecoin supply may be especially positive, as it has come alongside an upward trajectory in BTC itself, which the quant has highlighted in the chart.
Sometimes, the supply of these fiat-tied tokens increases because of capital flowing out from the volatile coins. In these situations, while the stable supply increase is bullish, it doesn’t mean much on the net as the prices of the assets said capital come from going down during the swap.
As Bitcoin has recently been going up instead of the stablecoin supply, which has been setting new highs, the capital must be coming from elsewhere, like outside the sector itself, indicating net capital inflows.
When investors want to buy into BTC and other tokens using their stables, they may use exchanges. As mentioned before, one of the indicators in the chart is for the stablecoins sitting on Binance, so its value can showcase the demand present among the holders to swap in the near future.
As this indicator has also been rising recently, many investors are actively looking to buy into Bitcoin right now rather than holding off their capital for future opportunities.
BTC Price
At the time of writing, Bitcoin is floating around $63,800, up almost 10% over the past week.
Looks like the price of BTC has been consolidating since its recent surge | Source: BTCUSD on TradingView
Featured image from Dall-E, CryptoQuant.com, chart from TradingView.com