
Bitcoin is pushing higher after months of consolidation, with buyers gradually reasserting control and the market beginning to feel like it might have found its footing. The strength is real — but a report from XWIN Research Japan is adding important context to what that strength actually means in the broader picture.
According to the analysis, global markets are not recovering evenly. The S&P 500 and Nasdaq have returned to all-time highs, which on the surface reads as a healthy, risk-on environment. But a closer look at the data tells a more selective story. Bitcoin remains approximately 40% below its own all-time high. Ethereum is sitting about 52% off its peak. Gold is down 12% and silver 34%. The assets that are leading this rally are very specific — and crypto is not among them yet.
What the divergence reveals is that this is not a broad wave of capital flooding back into risk assets. It is a targeted repricing in equities, driven by specific catalysts rather than a general improvement in financial conditions. Bitcoin and most crypto assets are sitting in the waiting room while that repricing plays out upstream.
For Bitcoin holders watching the price strengthen, that context matters. The recovery is showing early signs of life. But the macro picture suggests the bigger move may still be ahead rather than already underway.
Bitcoin Is Not Late — It Is Next in Line
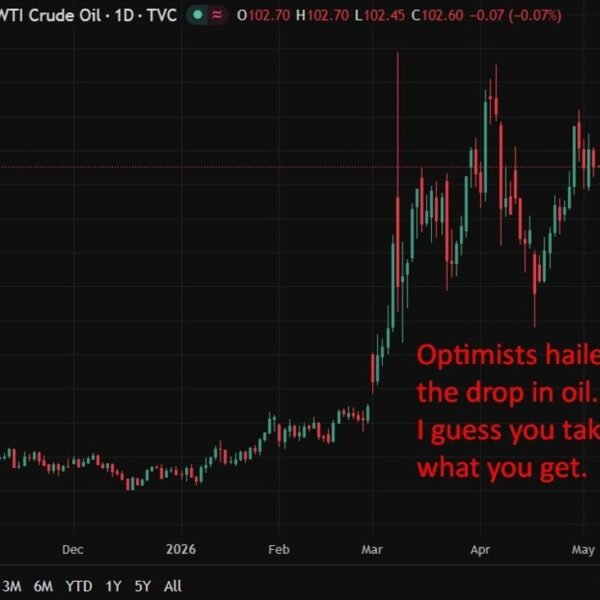
The XWIN Research Japan report makes a point worth understanding before drawing conclusions about Bitcoin’s relative weakness. The equity rally that has pushed the S&P 500 and Nasdaq to all-time highs is not the product of solved inflation or aggressive rate cuts. It is a repricing of tail risks — the market breathing out as geopolitical tensions ease and energy shock fears recede.
That is a meaningful distinction, because it means liquidity conditions are still tight and the conditions for a broad, sustained risk-on move have not fully materialized.

Capital flows through global markets in a fairly consistent sequence. Oil and commodities move first, followed by the dollar and interest rates, then equities absorb the shift, and finally the later-cycle assets — Bitcoin among them — receive what flows downstream. Right now, equities are at the front of that chain and crypto is still waiting its turn. That is not a failure. It is a position in a queue.
What makes the current setup interesting is what is happening beneath Bitcoin’s price in the meantime. Exchange reserves continue declining, accumulation is ongoing, and the structural on-chain picture is quietly improving even as price remains below key resistance levels. The report describes this as a pre-breakout phase — the conditions are building without the confirmation yet arriving.
Bitcoin’s lag behind equities, in this reading, is not a signal that something is wrong. It is a signal about timing. The structure is being built. The catalyst that sends capital down the chain is the variable still outstanding.
Bitcoin’s price structure shows a clear transition from capitulation to controlled recovery, with the market now testing a critical resistance zone near $75,000. After the sharp breakdown in early February—marked by a high-volume selloff that pushed BTC toward the low $60,000s—the asset established a base through a period of sideways consolidation. This range, roughly between $72,500 and $75,000, is highlighted on the chart as a key demand zone that has been repeatedly defended.

The recent breakout above the upper boundary of this range suggests that buyers are beginning to regain control, at least in the short term. Price is now pressing into the descending 100-day moving average, which has acted as dynamic resistance throughout the broader downtrend. The 50-day moving average has started to turn upward beneath price, indicating improving short-term momentum, while the 200-day moving average remains significantly higher, reinforcing the idea that the macro trend has not yet fully reversed.
Volume has normalized following the February spike, implying that the current move is not driven by panic or forced positioning, but by more measured accumulation. The key question now is whether BTC can hold above the reclaimed range. Sustained acceptance above $75,000 would shift the structure bullish; rejection would likely return the price to consolidation.
Featured image from ChatGPT, chart from TradingView.com
Editorial Process for bitcoinist is centered on delivering thoroughly researched, accurate, and unbiased content. We uphold strict sourcing standards, and each page undergoes diligent review by our team of top technology experts and seasoned editors. This process ensures the integrity, relevance, and value of our content for our readers.