
Bitcoin’s price action over the past week has been nothing short of amazing. After consolidating for several weeks below its all-time high, the leading cryptocurrency has once again surged past $125,000 to set a new price record.
Interestingly, a deeper look at Bitcoin’s weekly chart suggests that the rally could be far from over. According to crypto analyst Bobby Axe, Bitcoin is flashing a rare confluence of technical indicators that are known to precede explosive price movements. His analysis, which was shared on X alongside a detailed chart, lays out several signals pointing to a possible explosion to $144,000.
Seven Indicators Showing The Beginning Of A New Bitcoin Phase
Bobby Axe’s analysis noted that Bitcoin is on the verge of erasing over three months of sideways and corrective price action with “one weekly candle.” The Bitcoin chart shows the cryptocurrency consolidating within a tight range in the past few months. However, its most recent candlestick has launched upward, and this marks the beginning of a new expansion phase.
The second indicator of this new phase lies in the weekly candle itself. If BTC closes the week near its current highs, it will register its largest-ever weekly candle close in history. If it happens, this will confirm that Bitcoin has officially entered price discovery once again.
The analyst also highlighted multiple momentum-based indicators all converging in favor of a breakout. The third indicator of BTC’s new phase lies in the weekly RSI. The weekly RSI has reset around its median range and is now curling back toward overbought territory, a pattern that historically accompanies early stages of parabolic rallies.
At the same time, the Stochastic RSI has completed a bullish crossover above the 20 level, confirming higher timeframe bullish momentum. This is the fourth indicator.
The fifth bullish indicator is the weekly MACD histogram, which is showing waning bearish pressure. As the histogram flattens, it translates to a weakening of selling momentum and a potential shift back toward bullish dominance.
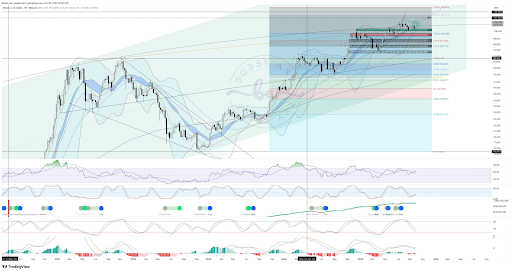
Bobby Axe also drew attention to the reappearance of three blue hash ribbon dots on Bitcoin’s weekly timeframe as the sixth indicator of a bullish Bitcoin. The last time this phenomenon was seen was in July 2020. Back then, it preceded the explosive 2020–2021 bull run that sent Bitcoin from around $9,000 to over $60,000.
Lastly, the weekly chart’s Bollinger Bands are notably tight due to intense volatility. This is notable because this is a condition that has preceded several of BTC’s most dramatic rallies.
BTC Price Explosion To $144,000
Together, these indicators suggest that Bitcoin is building strength beneath the surface, preparing for what could become its next major leg up.
If the alignment of these indicators holds true, Bitcoin may be in the early stages of another extended breakout. Fibonacci projection levels place the next target around $144,000, followed by an extended target at $158,000 if bullish momentum continues.
At the time of writing, BTC is trading at $124,430, having made a new all-time high of $126,080 in the past 24 hours.
Featured image from Adobe Stock, chart from Tradingview.com
Editorial Process for bitcoinist is centered on delivering thoroughly researched, accurate, and unbiased content. We uphold strict sourcing standards, and each page undergoes diligent review by our team of top technology experts and seasoned editors. This process ensures the integrity, relevance, and value of our content for our readers.