Thank you for your assistant
While Nike (NYSE:NKE)’s recent underperformance and guidance cut was unexpected, I believe the stock is even a better buy following the recent weakness. Buying blue chips that look like fallen angels is never easy with timing, but Nike’s current multiples and conditions look as good as they can get if we look at historical patterns. In this article, I share some reasons involving fundamental trends, Nike’s characteristics, valuation and technical considerations that support my decision to upgrade NKE to a Strong Buy.
Fallen Angel, Like Many Times Before
Nike shares are down 60%+ following the peak in late 2021. From a pattern recognition perspective, every 50% peak to through decline in Nike’s history has underpinned a great entry point for an investment in the stock that translated into significant outperformance over subsequent multi-year periods. This was the case following the 75%+ 1982-84 decline, the 50%+ decline in 1992-93, and the ~67% decline in 1997-2000. It was also the case in the “more moderate” decline of ~45% occurred in 2008-09.
While Nike shares have tended to track consumer discretionary quite well over time, it has recently detached from the sector starting in mid-2023. Following inflationary pressures on the cost of living and growing interest rates affecting loans and mortgages, consumer conditions are certainly not optimal, and indicators of consumer confidence remain relatively weak as indicated by metrics such as the University of Michigan’s consumer confidence index recently failing to stay above 70 and currently at 2008 levels.
Recent Top Line Weakness Does Not Appear Structural
Recent results have been poor, driven by an 8% decline in Nike direct revenue, and in North America in particular.
Performance at Converse continues to be horrendous with revenue of $480 million last quarter, down 18 percent on a reported basis and down 17 percent on a currency-neutral basis, primarily due to declines in North America and Western Europe.
Despite a decline in revenue, Nike is showing improving margin trends with a 110bps gross margin expansion YoY to 44.7% and cost efficiencies in operating overhead expense (down 9% YoY). Excluding other income of $127m, Nike’s adjusted EBT increased by 28% on a 2% revenue decline.
Nike disclosed that gross margin strength was primarily due to strategic pricing actions, lower ocean freight rates and logistics costs, and lower warehousing, partially offset by lower margin in NIKE Direct and unfavorable changes in net foreign currency exchange rates.
I believe that the business’s ability to maintain and expand gross margins during periods of revenue weakness confirms its strong pricing power and brand value, an asset hardly eroded by temporary sales weakness.
Weakness appeared to be driven by the more fashion-linked Lifestyle part of the business, while the Performance segment grew double digits in the fourth quarter with growth in many key sports, which could be further helped by the Olympic games starting this month.
Nike’s footwear business, which accounts for over two thirds of total group revenue, has a strong fashion component besides a cyclical one, and it’s unreasonable to expect it to perform strongly every year. The brand has experienced two years characterized by significant weakness and relative loss in customer interest compared to some key peers.
Global Google Trends is as weak as it was during lockdown periods, and similar conditions characterized attractive entry points in the past. Comparisons will get easier exiting the summer, which I expect to translate into better trends on a YoY basis.
Google Trends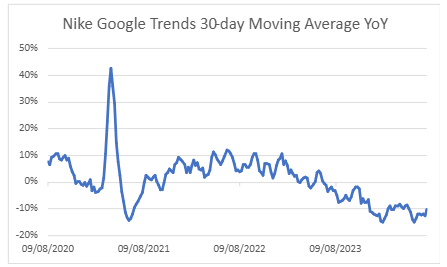
Unlike other segments of apparel and fashion, athletic footwear/apparel has always been characterized by strong concentration among a handful of brands controlling most of the market, and Nike has historically dominated and grown the gap with the other brands over time, being over twice the size of its closest competitor adidas.
Despite cyclical fluctuations and good and bad periods for each brand, Nike has remained the dominant player and I expect that to be the case for the foreseeable future. Nike’s strong position doesn’t come out of nowhere but is the result of a virtuous cycle that involves strong marketing firepower (over $4bn per year), a wide network of global sports sponsorships/endorsements at all levels (including five of the ten largest sports sponsorship deals in history), a large global network of direct and indirect retail access to customers (including strong bargaining power with retailers such as Foot Locker, JD sports, as Nike is necessary for these businesses’ survival), and planned scarcity/limited editions supporting brand value and margins.
While periods of outperformance from competitors such as Adidas and Puma have occurred cyclically, (e.g., the 2016-2017 period), such periods of underperformance have generally resulted in attractive entry points for a position in NKE.
I remember a time when Nike’s dominance in the athleisure market seemed uncertain to many investors. German competitors, backed by successful sponsorships in athleisure, appeared poised to overtake Nike. However, the landscape shifted and Nike did not succumb to the smaller players.
Nike and Adidas have since engaged in a dynamic competition, with periods of strong performance by one often coinciding with weakness in the other, creating contrarian investment opportunities. I believe this is just another iteration of the same theme, although it occurs in an environment where consumers face pressures.
Inventory and Margin Trends Suggest No Issues of Excess Supply
One important aspect to analyse for consumer discretionary businesses such as Nike to assess demand and short-term risks is the trend in inventories. A struggling business is more likely to find it difficult to reduce inventories, which may anticipate further sales and margin pressure.
I believe that comparing Nike’s days of inventory or overall inventory levels versus COGS and revenue to historical trends can give misleading insights due to the structural growth experienced by the DTC channel (where Nike holds its own inventories waiting to be sold) in the past ten years at the expense of third-party channels.
However, looking at relative trends of inventories and margins can give useful insights even in these conditions. Inventories for Nike declined by 13% YoY in Q3 on flat sales and were $7.5 billion in Q4, down 11%, reflecting a decrease in units. As in both cases, the decline in inventories came with gross margin expansion (130bps and 110bps, respectively) despite a decline in direct revenue, I believe this suggests the business is not dumping products at lower prices to reduce inventory levels.
Therefore, I believe the combination of inventory levels and gross margin expansion is a positive development that potentially indicates the absence of excess supply issues at these levels, with levels of inventories now potentially at equilibrium levels.
Current Multiples Are Potentially Below Fair Valuation
From a valuation perspective, the stock doesn’t look expensive compared to its history. NKE trades at ~18x TTM earnings which is a ~36% discount to the S&P 500’s ~28x. In my experience, blue chips rarely get significantly cheaper than this on a relative basis, and for Nike this comes with a potential inflection point if the inventory position and demand trends are effectively improving.
The global sportswear market is expected to grow at a 7% CAGR by 2030. Even without further margin expansion from the current EBIT margin of ~13%, a 7% growth rate in the next six years, normalizing to a terminal growth of 3%, with a discount rate of 9%, would translate into a fair P/E multiple of 21, which means NKE could be trading below fair value even in a relatively conservative scenario of no margin improvements.
Although there can always be discussions around the appropriate discount rate, I want to point out that Damodaran’s current estimate for a fair cost of equity in the apparel sector is a bit above 9%. However, there are hardly any companies with a competitive position similar to Nike and businesses like Nike would certainly skew the discount rate downwards, in my view.
On a relative valuation basis, the comparison with Adidas is not clean as the German competitor is doing even worse on most metrics and has recently posted a loss in net profit. However, even using an optimistic normalized level of EPS of €10 (expected to be reached only in 2026, per consensus), Adidas would be currently trading at 23x P/E, still significantly higher than Nike’s current multiples.
Nike is certainly not a high yielder, but its current dividend yield is at ~2%, the highest since the great financial crisis, for a business that has increased dividends almost every year and never cut annual payout in its history, including difficult years such as 2008 and 2020. This looks like an attractive entry point for a dividend growth position too.
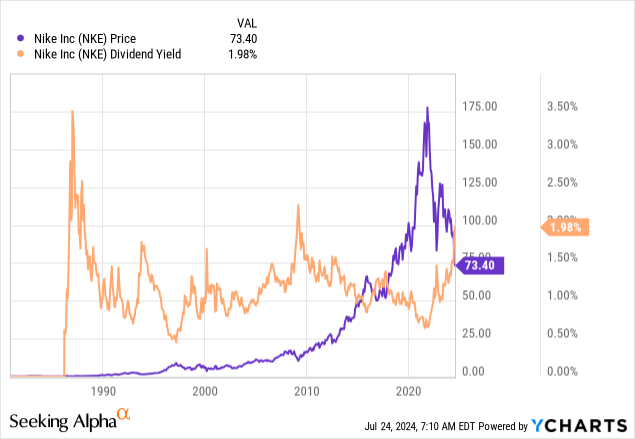
Technical Patterns Might Indicate a Contrarian Entry Point
Catching a falling knife is not something I like to do. Yet, there are fundamental conditions under which this can be a good strategy, and the technical picture for NKE in my view highlights oversold conditions that can support a position here.
Besides similar drawdowns leading to good entry points as pointed out at the beginning of the article, similar oversold conditions on the monthly chart (using an RSI on 8 months) have previously underpinned attractive entry points, with the exception of the one in late 2022, which still resulted in a ~60% rally.
TradingView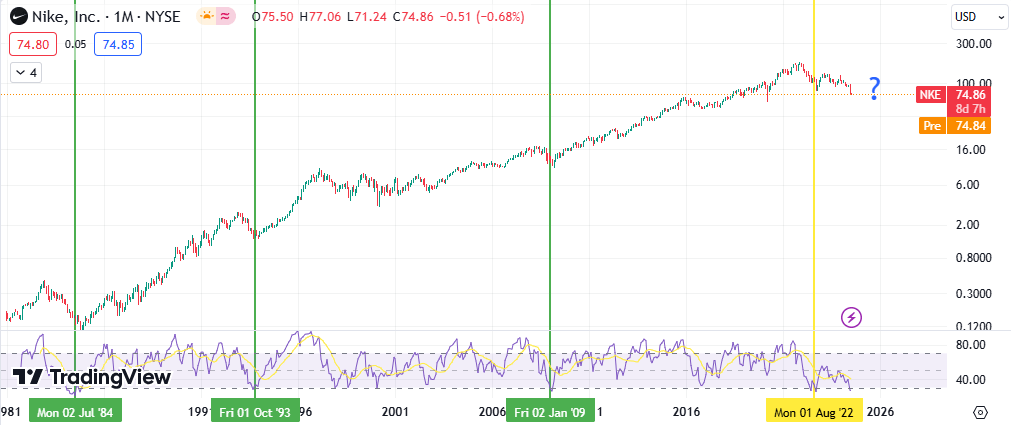
Risks
I believe this is an attractive entry point for a position in NKE, but every investment carries risks.
-
As a business that relies on consumers’ spending power, emerging macroeconomic weakness could hurt Nike’s business more than less discretionary ones.
-
Although Nike remains the sector’s leader, competition could intensify, or unexpected tailwinds might help competitors (lucky sponsorships, surprisingly successful product launches etc.).
-
Geopolitical tensions might lead to worse access or results in key markets such as China.
Conclusion
I believe Nike remains a healthy business currently experiencing another phase of short-term weakness that is somewhat natural given the fashion components in its operations, a situation that recurs cyclically without necessarily underpinning structural fundamental problems. The combination of lower inventories and gross margin expansion suggests fundamental conditions are improving. Valuation looks de-risked both in absolute and relative terms, and I see technical analogies with previous attractive entry points.
Editor’s Note: This article discusses one or more securities that do not trade on a major U.S. exchange. Please be aware of the risks associated with these stocks.

