The highlight of the agenda in the session ahead will be the UK CPI report. Here’s what you need to know going into the data release later at 0600 GMT. In that lieu, let’s take a look at the levels that are in play for GBP/USD and the potential reaction.
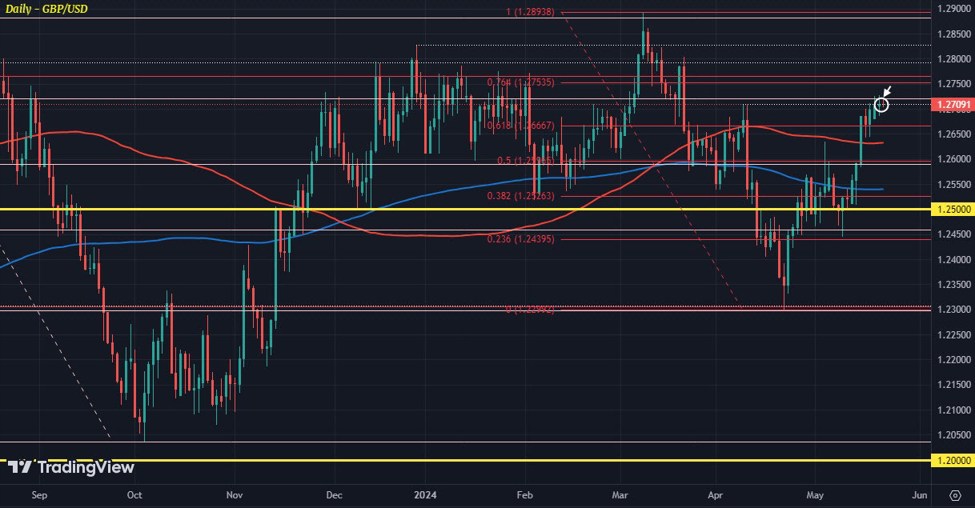
GBP/USD daily chart
The pair is now trading just above the 1.2700 mark with price action still lingering in and around the April high of 1.2709. Buyers are in control, so they already have the momentum on their side in that regard.
As such, if inflation proves to be stickier than anticipated, sterling bulls will be waiting to pounce on that opportunity. A push towards offers and some resistance around 1.2800 will be the next step. Then, buyers will be setting their sights on the March high of 1.2893 but that might be a stretch and would require help from the dollar side of the equation.
The flip side of that argument sees the near-term chart called into play instead:
GBP/USD hourly chart
GBP/USD buyers have been defending the more bullish near-term bias for a week now. They have been holding a defense at the key hourly moving averages, more notably the 100-hour moving average (red line).
As such, that will be the first line of defense to watch in the case of a softer-than-expected CPI report. That level is seen at 1.2693 currently. A break of that will see the near-term bias shift to being more neutral, opening up room for price action to roam between that and the 200-hour moving average (blue line) – now seen at 1.2631.
At the same time, the 100-day moving average at 1.2632 will also be a key technical support level to watch.
Sellers will need a simultaneous break below both the two key levels highlighted to find the next leg towards 1.2600. Only then, can we start talking about a trip back to 1.2500 again perhaps. But not before the 200-day moving average at 1.2540.
I reckon that might only come into play if traders are dead certain that the data today will cement a June rate cut move. But I fear that even with slightly softer inflation numbers, it might not be enough to give 100% certainty.
After all, the expected decline in the annual inflation rates for April is clouded by the decision by Ofgem to lower the energy price cap by 12%. So, the precise impact of that might be a tough one to read.