FUNDAMENTAL
OVERVIEW
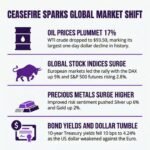
The S&P 500 surged into
new highs today and basically erased all the March losses after Trump announced
on Truth Social a two-sided ceasefire agreement for two weeks while the US and
Iran negotiate a lasting peace deal. The discussions will begin on Friday in
Islamabad and may be extended if both parties agree.
Given the de-escalation,
the risk sentiment in the markets turned around quickly and risk assets got
heavily bid. As you would expect, traders went back to price in rate cuts for
the Fed with now 14 bps of easing expected by year-end compared to basically
zero before the ceasefire announcement.
There’s still a risk that
the war could restart any time as the US and Iran haven’t officially ended the
hostilities. Nonetheless, the bias has now turned bullish for the S&P 500 given
Iran’s acceptance of the ceasefire despite being against it for a long time.
This will likely keep expectations positive for the negotiations.
It goes without saying that
if the negotiations fail and the conflict resumes, the S&P 500 will quickly
erase all the gains and likely extend the losses into new lows.
S&P 500
TECHNICAL ANALYSIS – DAILY TIMEFRAME
S&P 500 – daily
On
the daily chart, we can see that
the S&P 500 broke above the downward
trendline and surged into new highs after Trump announced the ceasefire. If we
get a pullback, we can expect the buyers to step in around the 6,765 support with
a defined risk below it to keep pushing into a new all-time high. The sellers,
on the other hand, will want to see the price falling back below the support to
pile back in and target a drop into the broken trendline.
S&P 500
TECHNICAL ANALYSIS – 4 HOUR TIMEFRAME
S&P 500 – 4 hour
On
the 4 hour chart, we have an
upward trendline now defining the bullish momentum. If we get a pullback into
the trendline, we can expect the buyers to lean on it with a defined risk below
it to keep pushing into new highs. The sellers, on the other hand, will look
for a break lower to increase the bearish bets into new lows.
S&P 500 TECHNICAL
ANALYSIS – 1 HOUR TIMEFRAME
S&P 500 – 1 hour
On the 1 hour chart, we can
see the price is currently trading above the upper bound of the average daily range for today. In such instances, we
can generally see some consolidation or a pullback before the next move.
UPCOMING CATALYSTS
Today we have the FOMC meeting minutes. Tomorrow, we get the US PCE price
index and the latest US Jobless Claims figures. On Friday, we conclude the week
with the US CPI report and the University of Michigan Consumer Sentiment
survey. As a reminder, we have also the US-Iran negotiations in Islamabad on
Friday.