jetcityimage
The iShares 20+ Year Treasury Bond BuyWrite Strategy ETF (BATS:TLTW) attracts a lot of attention from investors, likely due to the fund’s sky-high yield.
TLTW pays distributions monthly with the fund is scheduled to pay out $0.276948 on July 8th; if we annualize that payout, TLTW’s indicated yield is around 12.9%. The 12-month yield – the sum of all distributions over the past 12 months divided by the current price of the ETF — is about 15.8%.
I suppose it’s only natural to wonder how an ETF with a name that implies it buys long-term Treasuries (US government bonds) could possibly have a yield in the double digits. After all, benchmark 20- and 30-Year Treasuries haven’t offered a yield much over 5% at any time in recent years:
20- and 30-Year Treasury Yields (Bloomberg)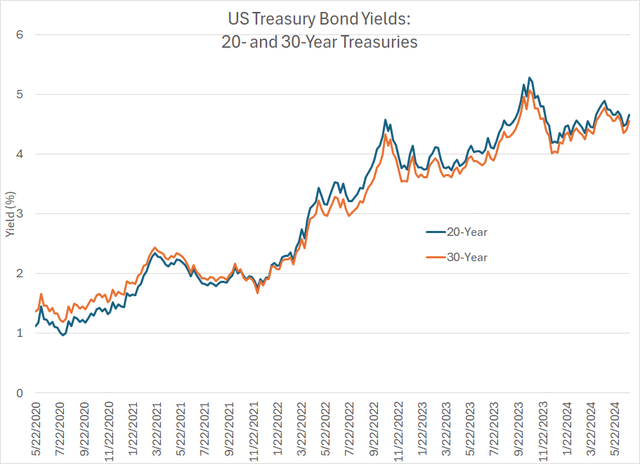
Indeed, according to Bloomberg, the last time the 30-Year Treasury offered a yield north of 10% was October 1987.
So, let’s take a closer look at this ETF, including the strategy and total returns under different bond market trading environments.
What is TLTW?
The core asset in the TLTW portfolio is a widely traded ETF called the iShares 20+ Year Treasury fund (TLT). TLT is one of the older fixed income ETFs in the US, listed for trading back in July 2002, and designed to own long-term Treasuries – US government bonds with 20 or more years remaining until maturity.
You can download the TLT fund’s exact portfolio holdings over on the iShares website right here. As of June 28th, some of the main holdings include around 7.8% of the ETF invested in the US Treasury Bonds Maturing on February 15, 2051, 7.1% of the fund in Treasuries of August 15, 2051, and 5.9% of the fund in Treasuries maturing on November 15, 2050.
The exact holdings aren’t important, but what’s crucial is TLT’s effective duration of 16.45 years, a metric which iShares also reports on their website. Duration is a measure of how long it would take (in years) for an investor to recoup the value of a bond through the cash flows from that bond (coupons and principal repayment).
More importantly, duration is a measure of a bond’s (or a fixed income ETF) price sensitivity to interest rates.
The longer the duration, the more the price of the bond will fall when rates rise, or rise when rates fall.
So, let’s put TLT’s duration in context:
Duration for Select US Bonds and ETFs (Bloomberg, iShares)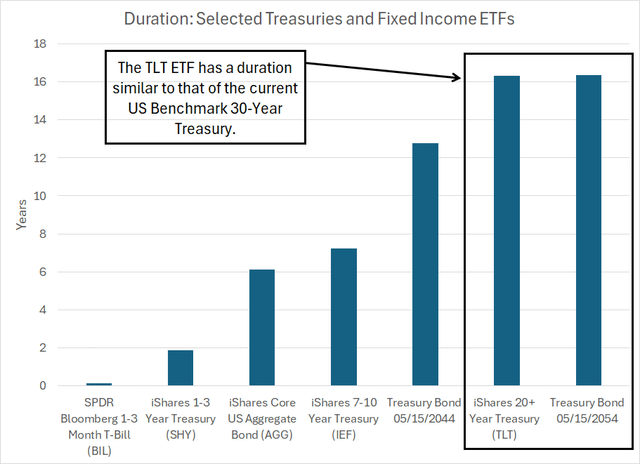
This chart shows the duration of several popular US fixed income ETFs as well as for the current benchmark 20-year and 30-year Treasuries, maturing in May 2044 and May 2054 respectively.
As you can see, while TLT is called the 20+ Year Treasury ETF, the duration is close to the same as for the 30-Year Treasury bond, and it’s one of the more rate-sensitive bond ETFs listed in the US.
As of the end of June, the TLT fund accounted for more than 99.3% of TLTW’s assets.
What differentiates TLTW from TLT is the overlay of a “buy write” or “covered call” options strategy:
Selling Calls to Enhance Income
A call option gives the owner the right, but not the obligation, to buy the underlying stock or ETF at a pre-set strike price on or before the expiration date of the option.
In a “covered call” or “buy write” trade, the investor sells (writes) call options on a security they already own to generate premium income. The best way to illustrate how this works is with a specific example, namely the covered call position currently held in the TLTW fund.
As iShares explains in its product brief for TLTW, the fund owns units of TLT and sells call options that expire approximately 30 calendar days (1 month) in the future, selling the number of call contracts that correspond to the quantity of TLT units owned by the fund (1 call contract covers 100 units of TLT).
Each month, one business day before the calls sold are due to expire, TLTW buys to close (repurchases) the calls and sells to open a new option contract that expires in about 1 month with a strike price that’s roughly 2% higher than the current price of TLT.
TLTW is currently long units of TLT and has sold contracts of the July 19, 2024 $96 call options to generate premium income. TLTW sold those July 19th call options back on June 20th, the day before June monthly options expiration for TLT, which was Friday, June 21, 2024.
Look at the chart of TLT since early May to get an idea how this strategy has worked over the past two months:
Price chart of TLT (Bloomberg)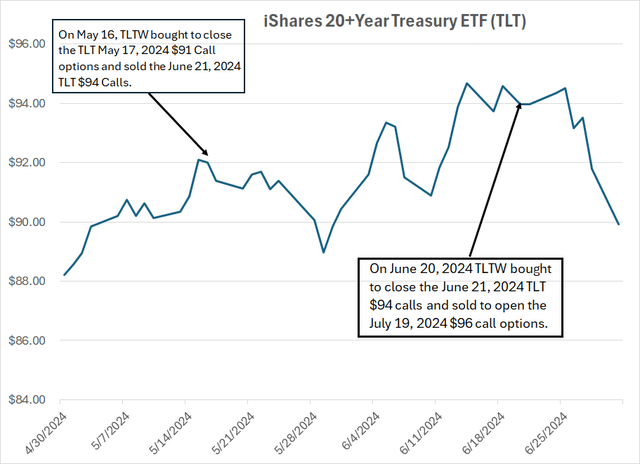
On May 16th, one business day before the expiration of TLT’s May monthly options on May 17, 2024, TLT was trading around $92 per unit. Specifically, according to Bloomberg, the volume-weighted average trading price for TLT during regular trading hours (9:30 AM to 4 PM ET) May 16th, 2024 was $92.14 per unit.
On that date, TLTW was long units of TLT and had sold (written) contracts of the TLT May 17, 2024 $91 call options, which were in the money on that date (TLT was trading above the strike price of the calls). TLTW bought to close the May 17th calls and sold to open contracts of the June 21, 2024 $94 call options.
As I said, TLTW seeks to sell calls with approximately one month until expiration and with a strike price about 2% above the current price of TLT. With the volume-weighted average price of TLT at $92.14 on May 16th, the $94 calls were about 2.02% out of the money — the June 21, 2024 $94 calls were the closest contract that fits TLTW’s 30 days out, 2% out of the money covered call strategy.
According to Bloomberg, on May 16th, 2024, the TLT June 21, 2024 $94 call options traded between $0.61 and $0.79 with a midpoint of about $0.70.
By June 20, 2024, one day before those June 21 $94 options were due to expire, the volume-weighted average price of TLT was $93.74. Consistent with its strategy, TLTW bought to close the June 21, 2024, TLT $94 calls and sold to open contracts of the July 19, 2024, TLT $96 calls.
That’s because a strike price of $96 was about 2.4% above the trading price of TLT on June 20th, the closest strike to TLTW’s 2% out-of-the-money strategy brief.
The good news for TLTW unitholders is the volume-weighted average price of the TLT June 21, 2024 $94 call options on June 20th was approximately $0.23, less than the value of the same calls a month earlier on May 16th.
Because the ETF was likely able to buy to close the June calls at a significant discount to the premium received in May, the covered call strategy yielded an additional profit kicker for the ETF.
So, let’s take a look at when this strategy is most effective:
Covered Calls Shine in Trading Ranges
When you sell out-of-the-money covered calls, there are three basic, potential outcomes:
-
The underlying (in this case, TLT) could rally significantly, rising above the strike price of the calls you sold.
-
The underlying could trade broadly sideways and remain below the strike price of the calls you sold.
-
The underlying could fall in price by a significant margin.
In scenario #1, the covered call strategy costs you money. That’s because when the price of the underlying rises by a significant amount, the value of the calls you sold will rise.
That means if you try to buy to close those calls on the day before expiration (the strategy employed by TLTW) it will cost you more to buy back the calls than the premium you received from writing the calls.
Of course, you still own units of the underlying and will still receive distributions paid by TLT, so you will benefit from the rally in TLT. However, selling the calls limits your upside beyond the strike price of the calls you sold.
In scenario #3, you will lose money with covered calls, though you’ll outperform the buy and hold investor in TLT. The value of underlying units of TLT owned will fall, but the calls you sold will also lose value. So, when you buy to close the short call position on the day before options expiry, you will realize a profit that will offset some of the losses incurred in the underlying.
And, as always, the covered call trader will still receive the distributions paid in the intervening period.
It’s scenario #2 where a covered call strategy really shines – when the underlying trades roughly sideways, the out-of-the-money calls you sell in a covered call strategy should lose value over time, resulting in a string of small monthly profits that supplement the monthly distributions you receive from the underlying.
Take a look:
Total Return Chart for TLT and TLTW (Bloomberg)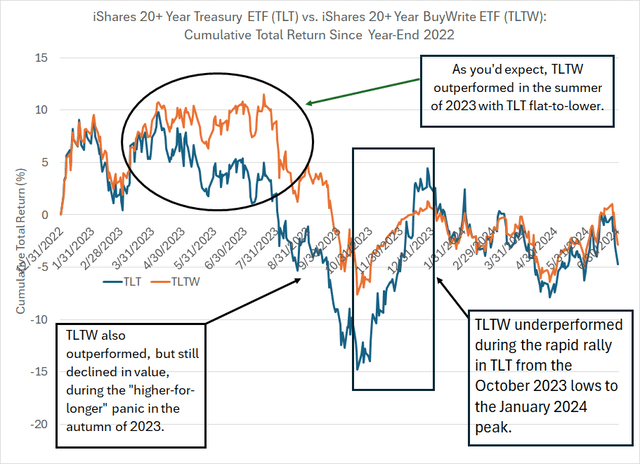
Since the end of 2022, the time frame covered by my chart, there have been periods defined by all three of these scenarios – a big rally in TLT, a big sell-off in TLT, and a range-bound market.
This is not a simple price chart of TLT and TLTW. That’s because price charts you might find on various financial websites don’t include the benefit of distributions received from TLT and TLTW – given how high distributions are for these ETFs (especially TLTW) simple price charts are largely irrelevant if you wish to evaluate performance.
Instead, this chart shows the cumulative total return from TLT (blue line) and TLTW (orange line) if you bought on the last trading day in 2022 and held through the close on July 1, 2024, reinvesting monthly distributions received into the respective ETFs.
Put simply, the price of TLT is down 9.7% since the end of 2022; however, the total return from buying and holding TLT over this time and reinvesting distributions is -4.7%
For TLTW, the price decline is 22.1%; yet, the total return is better than TLT, down just 2.8% despite the significant rise in long-term Treasury yields (declines in long-term bond prices) over the past 18 months. Indeed, per Bloomberg, the yield on the 30-Year Treasury stood at about 3.96% as of late December 2022, rising to just under 4.61% as of the close on July 1, 2024.
Let’s look at three distinct periods covered by this chart.
First is the spring and summer of 2023, roughly defined as the period from March through July 2023. Over this time period, TLT traded flat-to-slightly lower on a total return basis – the total return from buying TLT on March 2, 2023, and selling on July 31, 2023, was 1.6% while TLTW handily outperformed, rising 6.9% including distributions.
That’s scenario #2 I outlined above, covered calls tend to outperform in a range-bound market.
Then, starting in August 2023 and ending in mid-October, TLT sold off sharply – between the end of July and October 19, 2023, TLT lost 16.5% of its value even including distributions paid as the market fretted about the potential for higher-for -longer interest rates.
On October 19, 2023, the yield on 30-year Treasuries peaked around 5.11% according to Bloomberg.
This is scenario #3 I outlined above – a big sell-off in the underlying.
Again, as you’d expect, both TLT and TLTW lost money, though the premiums received from writing covered calls helped to soften the blow for TLTW and the covered call ETF outperformed the underlying by a little over 1.3%.
(That was cold comfort for TLTW buyers when you consider that TLTW was still down 15.2% in this time period.)
The final period I’ve labeled in my chart above – from October 19, 2023, to early January 2024 – brought a rapid rally in TLT, similar to scenario #1 I outlined above.
In this period, both TLT and TLTW saw positive returns; yet it’s the only one of the 3 scenarios I outlined where TLTW sees significant underperformance relative to TLT.
Specifically, between October 19, 2023, and January 2, 2024, units of TLT returned 19.9% including distributions reinvested while TLTW returned just 8.8%.
What’s interesting is that, while I haven’t labeled it on my chart, above we’ve seen more range-bound trading action since mid-February – scenario #2 above – allowing TLTW to outperform TLT over this period. From the close on February 14, 2024, through the end of June, TLT was up just over 0.2% including distributions while TLTW was up 2.1%.
And that brings me to my final point:
Why TLTW?
As I mentioned, TLTW listed for trading on August 22, 2022.
Since the close on that date, generally a tough period to own long-term US government bonds, TLT is down 12.3% compared to a negative 11.1% return for TLTW assuming you reinvested distributions into the respective ETF.
So, TLTW has outperformed since inception to the tune of about 1.2%.
If we instead assume you simply hold resulting cash in an account at the prevailing money market yield, TLTW is down 8.9% since inception compared to -11.9% for TLT – on that basis, TLTW has outperformed by around 3 percentage points.
Of course, as I just outlined, the relative performance of TLT and TLTW over shorter time frames depends on the current trading environment for long-term government bonds:
TLTW less TLT Total Return by Month (Bloomberg)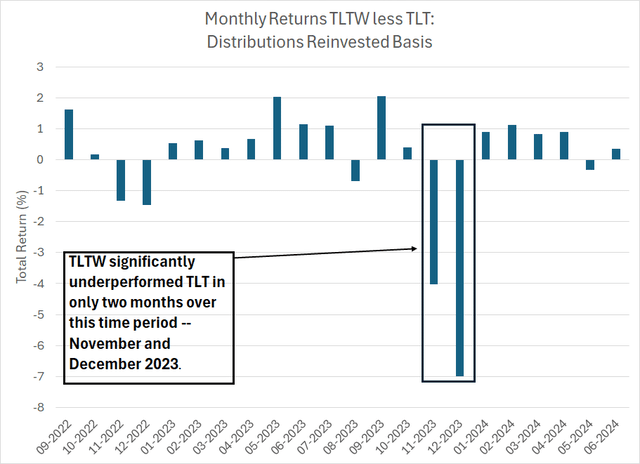
This chart shows monthly relative returns from TLTW and TLT on a distributions-reinvested basis from September 2022 through June 2024. A positive reading indicates TLTW outperformance in that month and vice versa.
Not only has TLTW outperformed TLT since inception in the summer of 2022, but the covered call ETF has also outperformed in 16 of the 22 full calendar months since it went public. That’s almost three-quarters of all months.
There are two (glaring) exceptions – November and December 2023, when TLTW underperformed TLT by a margin of roughly 4% and 7% respectively.
This was a period when TLT saw a strong rally, and TLTW’s strategy of selling calls to generate premium income limited its upside.
So, the real question is:
How likely is a repeat of the TLT’s massive November-December rally?
As it turns out, rallies of that magnitude are unusual for TLT:
Rolling 43 Trading Day Price Returns for TLT (Bloomberg)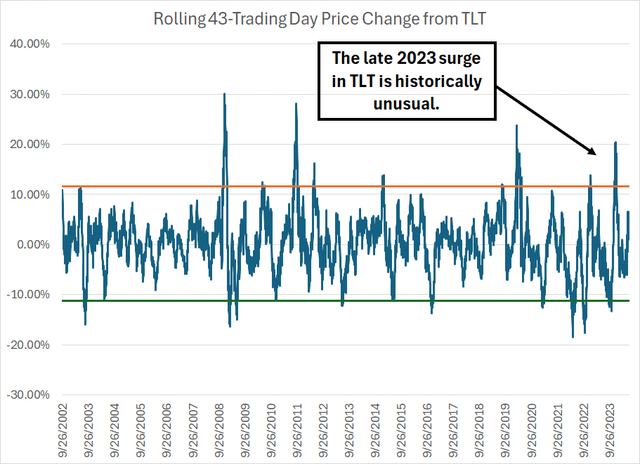
This chart shows rolling 43 trading day (approximately 2 calendar month) returns from TLT since its inception in 2002. The horizontal orange and green lines represent two standard deviation 43-day rallies and sell-offs, respectively.
As you can see, the 20%+ rally in TLT through late December 2023 is the fourth largest in over 20 years of trading history. The other, similar events occurred in March 2020, September 2011 and December 2008.
March 2020 brought a big rally in government bonds due to a flight-to-safety trade amid COVID lockdowns. Of course, the Fed slashed rates and re-started quantitative easing during the 2020 recession, helping drive a significant rally in long-term government bonds (lower yields).
Meanwhile, December 2008 was the height of the Great Recession and financial crisis era, a period when the government slashed rates to zero and investors fled a collapsing stock market for the safety of government debt.
In September 2011, in a widely anticipated move, the Federal Reserve announced “Operation Twist,” which involved selling short-term government bonds and buying longer-term debt to drive down yields. Of course, this benefited the sort of long-term bonds TLT holds in its portfolio.
More broadly, the sort of significant rallies in TLT that upend the TLTW covered call strategy are rare – out of the 5,480 rolling 43 trading day return periods covered by my chart above, only 212 (less than 3.9%) brought a more than 10% rally in TLT.
And the TLT rally in late 2023 that resulted in significant TLTW underperformance was more than twice that magnitude – 20.44% through December 27, 2023.
(That’s only happened in about 0.64% of all return periods on my chart.)
When we do see major short-term rallies in TLT, the catalysts fit into two broad categories:
-
Federal Reserve efforts to stimulate growth amid recession or rising risks to growth – as I explained, that was the case in 2020, 2011 and 2008.
-
A snap-back rally for bonds following a major sell-off, as was the case late last year. As you can see in my chart above, the 20% rally in TLT at the end of last year came immediately following a 2+ standard deviation sell-off in bonds (jump in yields) that peaked in October 2023.
In my view, neither of these conditions prevail right now.
We haven’t seen a major jump in yields over the past two months, as we experienced in the lead-up to the breathtaking November-December TLT rally last year. The biggest 43 trading day sell-off in TLT this year was about -6.5% through April 25, 2024.
Scenario #1 is a bigger risk in my view, as the US economy is clearly slowing, and economic data has been surprising to the downside:
Bloomberg Economic Surprise Index (Bloomberg)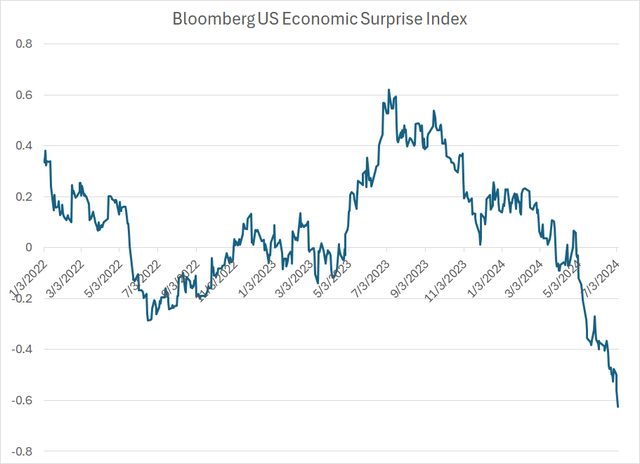
The Bloomberg US Economic Surprise Index compares incoming economic data to the consensus of analyst expectations heading into the release. The Index covers a trailing six-month period, where more recent data is weighted more heavily in the calculation.
As you can see, this index has taken a dive since May, suggesting economic data is weaker than Wall Street expectations.
It’s important to remember, however, that weaker-than-expected is not the same thing as negative – US economic growth is still positive and recent readings on the labor market and consumer spending suggest weaker growth, but growth nonetheless.
In short, until there’s a higher risk of recession, we’re unlikely to see a major rally in bonds (drop in long-term yields) on the scale that would upend the TLTW covered call strategy.
In that sort of range-bound yield environment, I’d expect TLTW to continue to outperform TLT.
When (and if) the economic data deteriorates further, and recession probabilities rise, it will be time to pivot, selling ETFs like TLTW and buying longer-duration ETFs that can benefit more from falling rates.
This article was originally posted on Smart Bonds.


