
Manoj Madusanka
Through chances various, through all vicissitudes, we make our way… – The Aeneid by Virgil, circa 19 B.C.E
To Our Clients and Friends:
As Virgil observed in his epic poem, we are all at the mercy of the unexpected, as we make our way. As investors, it is how we deal with the anxiety associated with the unanticipated that often determines our success. Investors who began the last twelve months thinking that the most aggressive interest rate increases of the last 15 years would continue to take a toll on public equity valuations, particularly longer duration technology shares, were in for quite a surprise.
The performance of a small group of US-based mega-cap technology stocks took off on a tear last year on the heels of improving inflation data helping to lead market capitalization weighted indexes to some of their better performances over the last two decades. The S&P 500 (SP500, SPX), MSCI World Index (in USD), and MSCI EAFE Index (in USD) finished calendar year 2023 up 26.3%, 23.8%, and 18.2%, respectively.
Even though Tweedy managed account portfolios overall had very little exposure to these market-leading tech companies, they continued on average to make significant financial progress.
Leading the global equity markets’ aggressive advance over the full year measurement period were a group of dominant US-based technology companies – Alphabet (GOOG,GOOGL), Amazon (AMZN), Apple (AAPL), META, Microsoft (MSFT), Nvidia (NVDA) and Tesla (TSLA) – sometimes referred to by market observers as the “Magnificent 7” or “Super 7.” As a group, they accounted for roughly 60% of the S&P 500’s 26.3% return and 42% of the MSCI World Index’s (in USD) 23.8% return for the year ending December 31. As a group, these companies produced a weighted average total return for the year of approximately 76% in the S&P 500.
Nvidia, the highly popular US-based developer of three-dimensional graphics processors and related software, finished the calendar year up 239.0%. Returns for the rest of the global equity market, as measured by the MSCI World Index (‘USD’), were not as good. Likely factors playing a role in this rather surprising, but narrowly led advance, included declines in the headline consumer price index, the resilience of the US banking sector post the March 2023 crisis, evidence of continued economic strength particularly in the labor market and service sector, and enthusiasm about the prospects for AI (artificial intelligence)-related technologies. All of these factors and others appeared to fuel investor hopes for a soft economic landing and the avoidance of the long-expected inflation and interest rate-driven recession. So far so good, but with equity valuations, particularly in more speculative parts of the market, soaring, and financial conditions continuing to tighten in many, if not most parts of the world, the sustainability of this advance may very well hinge on those hopes being fulfilled.
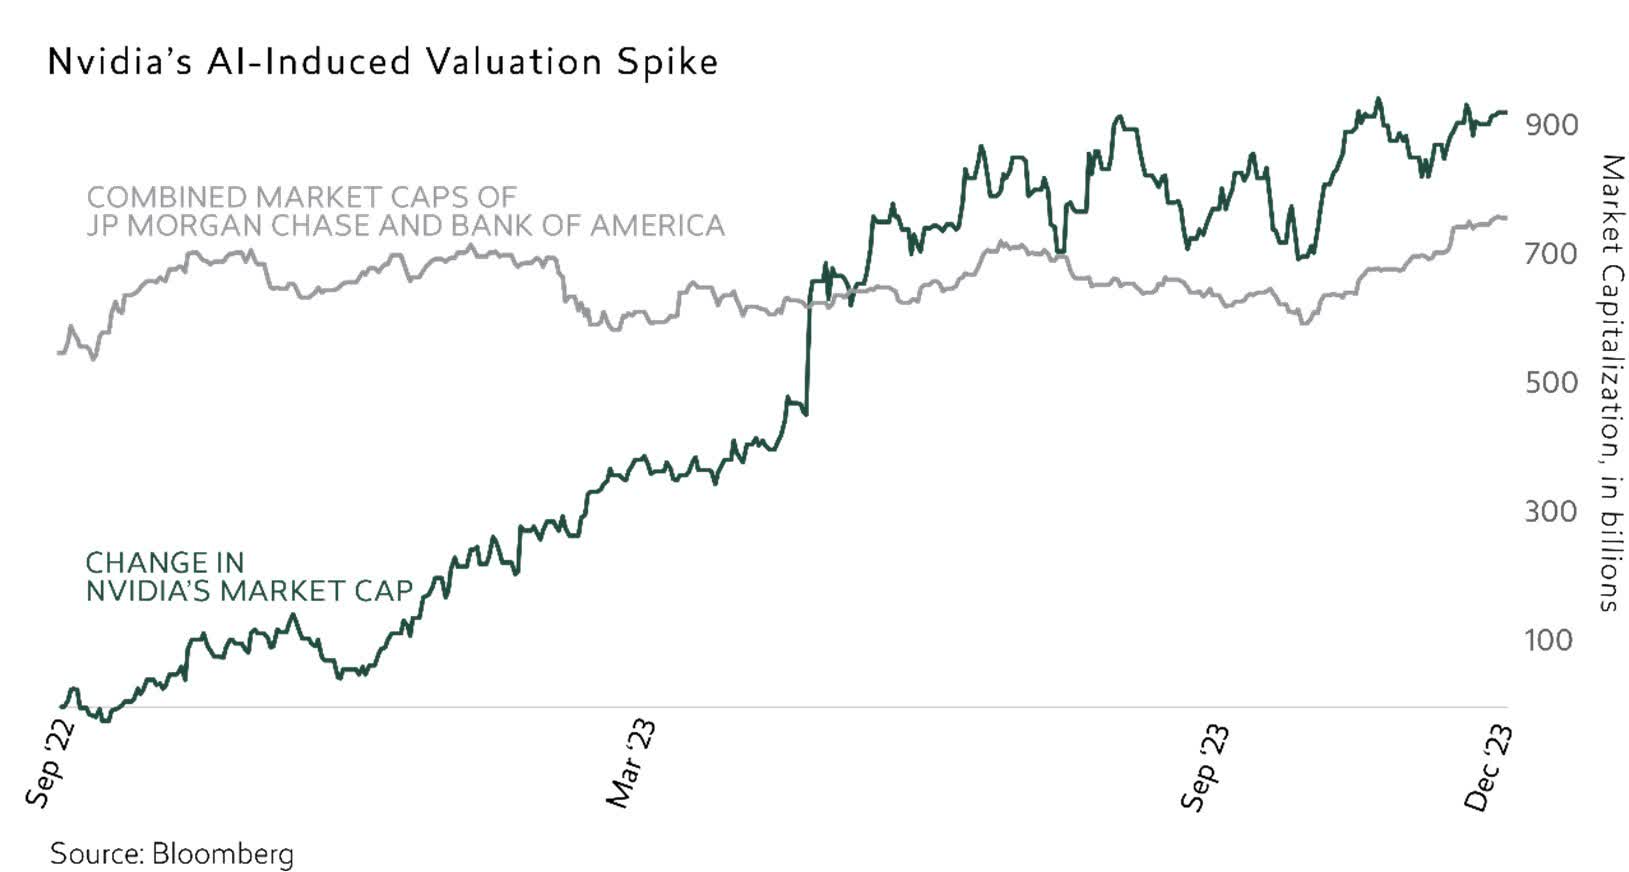
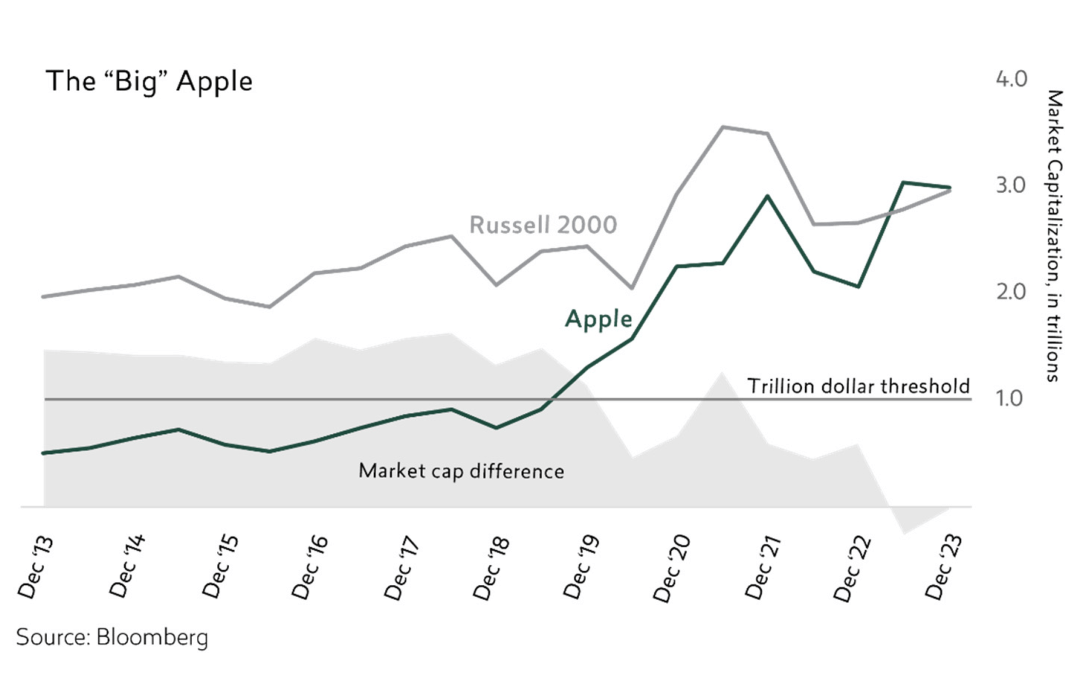
Equity valuations for the “Magnificent 7,” at least in our humble view, despite a small pullback in the third quarter, remain perilously high, and geared for perfection. While we realize Apple is one of the greatest and most innovative American companies, and Warren Buffett’s single largest public equity position at Berkshire Hathaway, we were astonished to learn that as of December 31, it was trading at a valuation that is greater than the entire Russell 2000 universe of smaller capitalization companies. Nvidia has more than quadrupled in terms of its market capitalization since September 2022, growing in value by over $920 billion (through December 31, 2023), an amount greater than the combined market capitalization of our country’s two largest banks. And this was all achieved in just 15 months with interest rates across the yield curve at levels that were many multiples of where they were just 24 months ago. (Reference: The Seven Companies Driving the U.S. Stock Market Rally, The Financial Times, Katie Martin and Nicholas Megaw, June 15, 2023).
Despite last year’s rebound of the Magnificent 7 and their impact on capitalization-weighted indices, we continue to believe that we are in the midst of a tectonic shift in markets, catalyzed in part by the war in Ukraine and pandemic-related supply shocks, but driven primarily by a stubbornly persistent level of core inflation and interest rates that in our view over time are likely to normalize higher than the zero bound levels of the last decade. Evidence of this shift sparked a pullback of both technology shares and market indices in the third quarter, as Fed officials reaffirmed that interest rates are likely to remain higher for longer. By quarter end, the yields on six-month to two-year treasuries had risen to between 5.0% and 5.6% while the 10-year was at 4.6%. However, this more muted market sentiment did not last long. Sparked by improving inflation data and the increased prospects for possible rate cuts early in 2024, an aggressive and more broadly based “Santa Claus” rally helped to drive equity valuations higher around year-end. That said, with low-risk treasuries now presenting a meaningful alternative to previously yield-starved investors, incentives to take equity risk, particularly in high technology shares where valuations appear to be stretched, may eventually begin to lessen. As we have said in past letters, in such an environment, price matters again, which we believe over time should augur well for active equity investment.
Our managed account portfolios, on the whole, continue to be refreshed by investment in a significant number of new smaller- and medium- capitalization companies, with new idea flow over the last year remaining quite robust. Our investment focus has continued to be on companies we view as financially strong, that appear to have pricing power and demonstrable competitive advantages, and companies where knowledgeable insiders, i.e., the companies’ C-suite level officers and directors, have been actively purchasing their companies’ shares at or around the prices our managed accounts are paying for those shares. Our approach has generally led to our managed account portfolios reflecting a differentiation from their benchmark constituents and weightings.
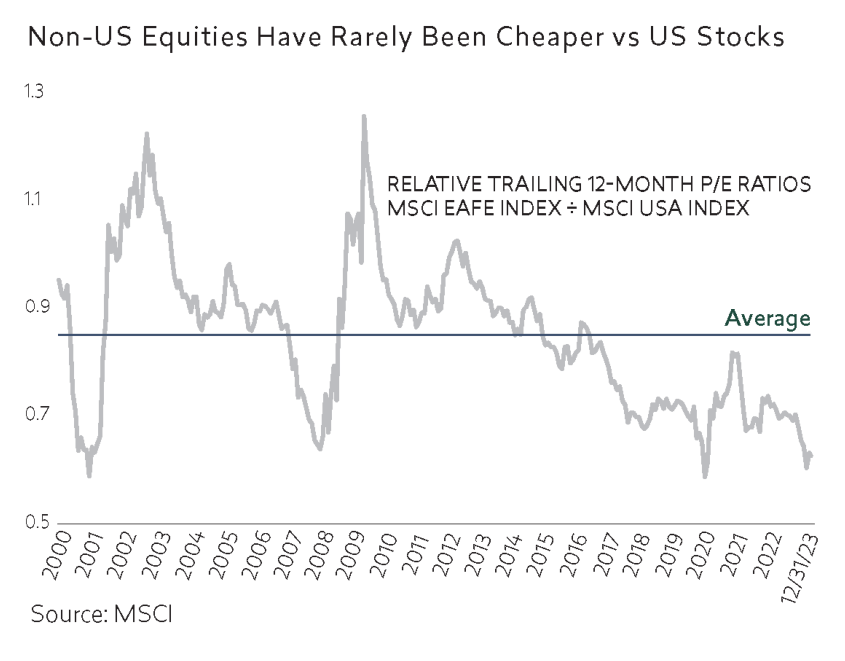
We are also pleased to report that the relative performance of non-US equities has improved vis-à-vis the performance of their US counterparts over the last two years plus. There will be more on that later in this letter. As you can see in the table below, if you were to strip out the performance of the Magnificent 7 from the S&P 500 return, the MSCI EAFE Index (in local currencies) actually outperformed the S&P 500 over the last twelve months. And the good news is that if you were prudent, you would not have had to pay up for the (in our view) more attractively valued non-US companies. In our view, as reflected in the graph below, non-US equities as a group remain significantly undervalued, near 20-year lows relative to US equities, and are cheap on an absolute basis as well.
S&P 500 Returns Ex the Magnificent 7 Vs the MSCI EAFE Index (local)
1 YEAR RETURNS (12/31/2022 – 12/31/2023)
|
S&P 500 |
26.29% |
|
S&P 500 (EX-MAGNIFICENT 7) |
13.75% |
|
MSCI EAFE INDEX (LOCAL) |
16.16% |
Insider Intelligence: Continuing to Light the Way
A strong, if not predominant, factor driving new idea generation in our managed account portfolios over the last year continued to be material insider buying in companies that, at purchase, were trading at significant discounts to our estimates of their underlying intrinsic value. We have always felt strongly that purchases of shares by knowledgeable insiders at times when their company stock is trading at low prices in relation to metrics such as book value, earnings and/or cash flow can be a powerful clue to possible future outperformance of their companies’ shares. Empirical evidence supports this view. As a reminder, the term “insider buying” refers to legal purchases of shares in their own company by corporate “C suite executives,” corporate directors, and large shareholders. We also take an interest in studying companies that are buying back their shares, particularly when they appear to be undervalued.
Thanks to the increasing power and complexity of centralized data aggregation, various data services can now deliver this information to us on companies from all over the globe on a daily basis and in a variety of formats that enhance the data’s efficacy. For example, these services allow us to now track longer-term purchase patterns by insiders together with valuation metrics for the company’s shares at times of purchase, and the price performance of the shares after purchase. Companies can also be ranked based on the strength of recent insider trading patterns in their shares. Some of these services also track share buyback activity by companies including number of shares bought back, prices paid, associated valuation metrics at the time of purchase, and the history of the company’s buyback behavior. This kind of information, which we sometimes refer to as “insight information,” serves as an important complement to our more in-depth quantitative and qualitative fundamental analysis.
Over the last twelve months, we established several new positions in many of our managed portfolios, and added to a number of positions where insider buying played a meaningful role in our decision-making. A few of those positions, including our rationale for purchase, are highlighted below. Unless otherwise indicated, all data contained in these descriptions reflects research conducted at or around the time of our initial and/or subsequent purchases. (Of course, a favorable fact pattern does not guarantee a successful investment outcome. The positions highlighted below are just a few of many stocks held by one or more managed account portfolios. They may or may not turn out to be successful investments.)
U-Haul (UHAL)
Founded in 1945, U-Haul is the largest do-it-yourself (DIY) moving equipment rental business and the fourth largest self-storage operator in North America.
U-Haul is dominant in the DIY moving equipment rental market (with estimated ~40-50% market share). With 23,000 stores, U-Haul is significantly larger than its national competitors Budget and Penske. The business has high barriers to entry and strong network effects. For customers, U-Haul often presents the best combination of proximity to origin and destination, equipment availability, and pricing. Moreover, the ubiquity of the U-Haul brand, ever present on North American highways, reduces the need to spend advertising dollars to generate new business.
U-Haul also operates 1,920 self-storage locations in the US and Canada, comprising approximately 81 million square feet combined owned and managed (of which 58 million is owned). It has a roughly 4% market share in a still-fragmented market (largest player has 13% share). Since 2013, U-Haul has grown total owned self-storage square footage at a 13% compound annual growth rate (“CAGR”). Importantly, we believe the rapid expansion of this business segment masks underlying, latent earnings power. New self-storage units typically take three to four years to become cash flow positive. Today, ~57% of U-Haul’s owned self-storage square footage is considered “non same store”, which means they are less than three years old and/or have had less than 80% occupancy for the last two years. As the newer self-storage facilities mature, we believe significant latent earnings power embedded in the real estate portfolio will be unlocked.
When estimating the intrinsic value of U-Haul, it’s important to recognize that both the moving and self storage businesses benefitted from a material post-Covid boost, which started to inflect in the latter part of 2022. Thus, we used lower “normalized” earnings estimates in order to avoid capitalizing peak earnings, and to arrive at our estimate of intrinsic value for U-Haul we applied an 11x multiple to our view of “normalized” EBIT for the moving business and a conservative replacement build cost per square foot method for the self- storage business. With these assumed inputs, we concluded that U-Haul’s business had the potential to be worth up to approximately $70/share as of the quarter ended June 30, 2023. Notwithstanding, there remains the risk that the degree of inflection in U-Haul’s earnings post its Covid boost could have a more detrimental impact to near term earnings comparisons, and the risk inherent in all value investing that the market will not recognize a security’s intrinsic value for a long time, or that a security thought to be undervalued may actually be appropriately priced when purchased.
There has been significant recent insider buying at U-Haul. The Chairman and CEO, Edward (‘Joe’) Shoen, and his brother Mark Shoen spent a total of $78 million purchasing the voting shares at an average price of about $58 per share between November 2022 and March 2023. The Shoen family collectively owns 61% of the voting shares and 43% of the non-voting shares. While there has previously been family in-fighting within the Shoen family, the company under Joe Shoen’s leadership has maintained management stability for the last 30-plus years, quietly and progressively growing the franchise and shareholder value. Because of the higher liquidity and lower price, initial purchases for managed portfolios were of the non-voting shares at prices, on average, of approximately $50.50 per share.
Brenntag (OTCPK:BNTGF, Germany)
Established in 1874, Brenntag is the world’s largest independent chemical distributor. The company is highly diversified across customers (~180,000), products (>10,000), suppliers (several thousands) and end markets. Brenntag is the largest operator in each of two distinct segments: commodity chemical distribution and specialty chemical distribution. The chemical distribution industry is highly fragmented, with Brenntag having only 5% share (and the top six only 12% combined), offering a long potential runway for roll-up acquisitions. The industry historically has grown in excess of Gross Domestic Product (“GDP”). Moreover, businesses such as Brenntag have exhibited margin stability and consistent free cash flow. For these reasons, the industry has long attracted the interest of private equity buyers.
Chemical producers rely on scaled distributors like Brenntag to purchase, repackage and deliver less-than-truckload shipments (on average EUR4,000 per order) to numerous small- and mid-sized customers. In commodity chemicals distribution, Brenntag’s competitive advantage is its economies of scale (higher purchasing power and network density), global reach, and high safety standards. In specialty chemicals distribution, the ability to provide technical support and capabilities in new product formulation are more important. Brenntag has 81 research & development labs globally. Having the largest product portfolio in the industry gives it a unique toolbox to help formulate new products.
We believe Brenntag’s specialty chemical distribution segment (Brenntag Specialties, ~40% of EBITA) is inherently a more valuable business than Brenntag’s commodity chemical distribution segment (Brenntag Essentials, ~60% of EBITA). Specialty chemical distribution has typically produced higher value add, higher margin, higher return on capital and higher growth. Publicly traded pure play specialty chemical distributors have traded at higher valuations. Pure play specialty distributors have commanded higher multiples in observed M&A deals. Thus, we believe that value would be maximized by separating specialty chemical distribution from commodity chemical distribution.
Historically, Brenntag managed commodity & specialty chemical distribution under one roof. However, in part due to a changing market landscape and in part due to activist pressure, this structure is changing. Management is in process of further differentiating the two segments and enabling them to operate more autonomously. Profitability between the two segments is now being disclosed separately. While management to date is non-committal, a full separation remains a distinct possibility. While our rationale for purchase and our valuation methodology are not contingent on the occurrence of such a separation, we believe the failure to separate these business segments could pose a risk for full value recognition in the market over time.
Around quarter end, Brenntag was trading at approximately EUR83, or approximately 11x estimated 2023 adjusted Earnings Before Interest, Taxes, and Amortization (‘EBITA’), which we believe is likely a good proxy for “normalized” earnings. To arrive at our estimate of intrinsic value for Brenntag, we applied different multiples for its specialty chemical distribution segment (higher multiple) and its commodity chemical distribution segment (lower multiple) and arrived at a 12x blended multiple for the entire business. This input led us to conclude that Brenntag has the potential to be worth up to approximately EUR94 per share as of December 31, 2023. Notwithstanding, there remains the risk inherent in all value investing that the market will not recognize a security’s intrinsic value for a long time, or that a security thought to be undervalued may actually be appropriately priced when purchased.
There had been insider buying activity by more than ten senior executives or board members (including the CEO) from March 2022 until August 2023, at an average price of ~EUR70/share. On August 30 it was disclosed that Kuehne Holding (controlled by Klaus-Michael Kuehne of Kuehne+Nagel) had doubled its stake in Brenntag from 5.2% to 10%, becoming the company’s largest shareholder, in the process spending several hundred million euros. Kuehne + Nagel is a successful freight forwarding business headquartered in Switzerland. While not officially considered an “insider,” Mr. Kuehne clearly has significant experience in logistics-related businesses, and Kuehne Holding has ties to Brenntag. The former Chair of Brenntag’s Supervisory Board (who just left in June) recently joined Kuehne Holding, and Brenntag’s current Deputy Chair is also on the board of Kuehne Holding.
Our first purchases were relatively small positions established back in mid-March of 2023 at a price of approximately 66.1 EUR per share. Since then, we have continued to take a deeper dive into the company both qualitatively and quantitatively, and added to our positions shortly after quarter end.
Teleperformance (OTCPK:TLPFF, France)
Based in France, Teleperformance is the global leader in the customer experience (‘CX’) industry with a 7.5% market share according to the Everest Group. In its most basic form, the company operates call centers. Investors previously considered Teleperformance to be a reliable secular growth company, but many now believe that artificial intelligence (‘AI’)/ChatGPT will materially disrupt its business. Given this, the company, in our view, sells for a discounted valuation of 8.6x its Enterprise Value (‘EV’)/Last-12Months (‘LTM’) EBITA (as of February 22, 2024).
Historically, larger industry players like Teleperformance had scale advantages that allowed them to invest in technology, provide a global offering to customers and more efficiently manage the labor intensity of the business among other things than their smaller peers. In addition, CX companies directly interact with their clients’ customers and are extensions of their brands. As a result, many companies that outsource these functions will pay some premium for quality and consistent service. These dynamics have allowed Teleperformance to earn a high-teens Return on Equity (“ROE”) and a mid-teens EBITA margin on average since 2018.
The CX industry has benefited from increased outsourcing as companies increasingly rely on third parties to perform these functions. In fact, outsourcing penetration has increased from 22% in 2010 to 31% in 2022 according to the Everest Group. The growth in outsourcing as well as market share gains have allowed Teleperformance to generate 10% average annual organic revenue growth since 2012 through 2023.
Despite all of this, investors are now concerned that AI will automate many customer service activities and, therefore, negatively impact Teleperformance’s business. We disagree with this. The CX industry has always experienced automation, yet has continued to grow as customers outsourced more of their activities. We believe that trend should continue. In addition, Teleperformance, in our view, is well suited to manage these AI functions for companies given how it currently supports them. Finally, we believe AI will also benefit Teleperformance as it has the potential to improve customer service agents’ productivity.
As of October 11, 2023, Teleperformance had an annual dividend yield of 3.2% and is in the process of executing a 500 million euro share repurchase program. Insiders have been buying shares in the company as well. Teleperformance’s Deputy CEO purchased $386,835 of the company’s shares in August and $360,530 in May. Several directors have also purchased shares. The stock has been quite volatile over the last many months and we made multiple purchases of the company’s shares across managed portfolios at prices that varied between $114.9 and $157.5 per share.
Performance
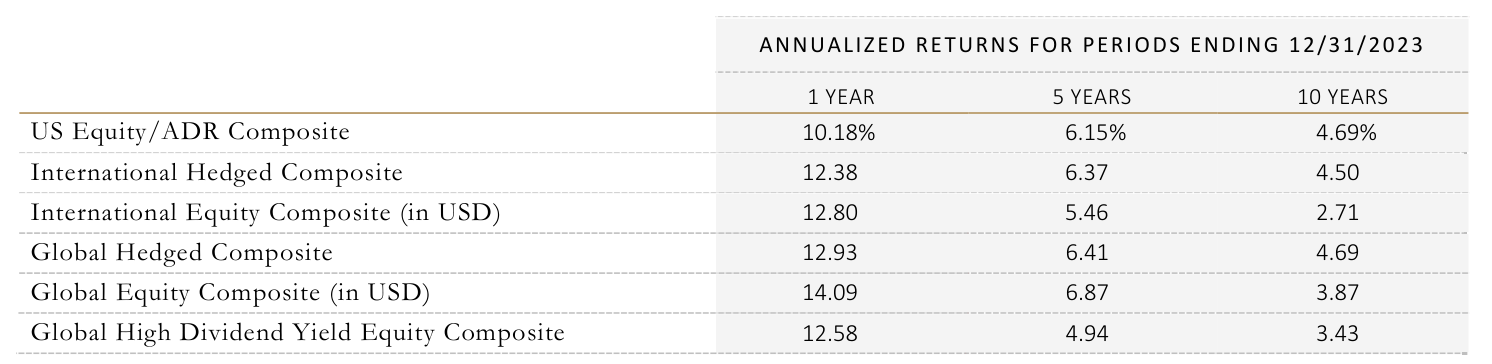
Despite having relatively modest exposure to the “Magnificent 7,” Tweedy, Browne’s managed account portfolios, in most instances, made substantial financial progress over the last year. While their returns paled in comparison to those market-leading tech companies, and trailed their respective benchmark indices, they were quite strong on an absolute basis, and we would submit, very attractive on a risk adjusted basis: For the twelve months ending December 31, 2023, our performance composites were up as follows (net of fees): US Equity/ADR Composite, 10.18%; International Equity Composite (Currency Exposure Hedged to USD), 12.38%; International Equity Composite (In USD) 12.80%; Global Equity Composite (Currency Exposure Hedged to USD) 12.93%; Global Equity Composite (In USD) 14.09%; Tweedy, Browne Global High Dividend Value 12.58%.
| Please see important disclosures regarding the Composites and their complete investment records starting on page 15. Past performance is no guarantee of future results. |
As a reader of our letters, you are familiar with our thesis that a rotation back into more value-oriented equities began in the fourth quarter of 2020. A review of the data since that quarter clearly supports the notion that value investing may indeed be back, or at a minimum, on its way back. Furthermore, as we suspected, non-US equity markets have been a beneficiary of this apparent move back to value. As you can see from the following chart, the value component of the S&P 500, the MSCI EAFE Index, and the MSCI World Index, in each instance, significantly outperformed its growth counterpart. For those that feel that value and international investing are dead, we would encourage them to think again.
The Ongoing Rotation to Value Cumulative Index Returns (in Local Currency) (09/30/2020 – 12/31/2023)
|
S&P 500 VALUE |
65.7% |
|
S&P 500 GROWTH |
34.1% |
|
MSCI EAFE VALUE INDEX |
62.6% |
|
MSCI EAFE GROWTH INDEX |
24.4% |
|
MSCI WORLD VALUE INDEX |
50.8% |
|
MSCI WORLD GROWTH INDEX |
35.6% |
Portfolio Attribution
Please note that the individual companies discussed herein represent holdings in some of our managed accounts but are not necessarily held in all of our managed accounts.
With the global economy continuing to hold up rather well in the face of higher interest rates, it was the more economically sensitive components of our managed account portfolios that continued to lead account returns over the past year. This included strong results in the industrial and financial segments, more specifically aerospace & defense, air freight & logistics, machinery, and insurance holdings. In addition, many of our accounts enjoyed strong returns in a number of their interactive media, oil & gas, and healthcare holdings. This included strong returns from companies such as jet engine manufacturer, Safran (OTCPK:SAFRF); defense contractors, BAE (OTCPK:BAESF) and Rheinmetall (OTCPK:RNMBF); air freight companies such as FedEx (FDX) and DHL Group (OTCPK:DHLGY); machinery companies such as Trelleborg (OTCPK:TBABF), SKF, and Sumitomo Heavy (OTCPK:SOHVF); reinsurers, SCOR (OTCPK:SZCRF) and Munich Re, and National Western Life (NWLI); interactive media company, Alphabet (Google); energy giant, TotalEnergies (TTE); and biotech holdings such as Vertex (VRTX) and Ionis Pharmaceuticals (IONS). Warren Buffett’s Berkshire Hathaway (BRK.A, BRK.B); German healthcare conglomerate, Fresenius (FMS); Mexican Coca Cola bottler, Coca Cola FEMSA (KOF); Italian construction company, Buzzi Unicem (OTCPK:BZZUF); the Dutch brewer, Heineken (OTCQX:HEINY); the kitchen designer, Howden Joinery (OTCPK:HWDJF); and auto-related company, Autoliv (ALV), also produced a strong return during the year.
The Japanese component in many of our clients’ managed account portfolios was also a significant contributor to return during the period. Japanese chemical company, Kuraray (OTCPK:KURRF), and Sumitomo Heavy, the industrial equipment manufacturer, also produced strong returns. Change would appear to be afoot in Japan. The largest Japanese stock exchange, the Tokyo Stock Exchange has been pushing its listed companies to pay more attention to share valuation and shareholder returns, specifically targeting companies whose shares have traded below book value. Japanese companies seem to have gotten the message, and many are now promising better growth, profitability, and governance. The Nikkei Index (NKY:IND) was up 31% last year (December 31, 2022 – December 31, 2023) after hitting its highest levels since the late 1980s in early July. The country’s markets also got a vote of confidence from Warren Buffett, who some time ago took positions in a handful of Japanese trading companies, and more recently increased his stakes. He even flew to Japan in April 2023, to demonstrate support for the trading companies and to meet with corporate executives.
Could the Japanese market be awakening from its long economic slumber? If the past is prologue, it will likely take time, but there is no question that change seems to be afoot in the world’s second largest equity market. While we have increased positions in Japan in many of our clients’ managed account portfolios over the last couple of years, our international portfolios still remain significantly underweighted in Japanese equities relative to the MSCI EAFE Index, while many of our global portfolios now have weightings that are closer, if not marginally greater, than the weight of the MSCI World Index. The underweight in our international portfolios has been a factor in the underperformance of our composites versus their benchmarks in recent years. Olivier Berlage, our long time Japanese-speaking analyst, continues to unearth what we believe to be bargains in Japan, particularly in smaller and mid-sized Japanese industrial companies.
In contrast, a number of the managed accounts’ media, healthcare, containers & packaging, IT Services, and real estate related holdings produced disappointing returns for the year. This included declines in the stock prices of the Japanese advertising company, Dentsu Group (OTCPK:DNTUF); the Mexican Cable Company, Megacable (OTCPK:MHSDF); the television streaming and movie production company, Paramount Global (PARA); pharmaceutical companies, J&J (JNJ) and Roche (OTCQX:RHHBY); containers & packaging company, Sealed Air (SEE); IT service company, Concentrix (CNXC); and China-based real estate company, Hang Lung (OTCPK:HLPPY).
In addition, FMC, the US based crop chemical company; UK spirits maker, Diageo (DEO); CNH (CNHI), the formerly Italian and now US-listed farm equipment company; and Teleperformance, the French professional outsourcing company, all had a difficult year in terms of market returns. Chinese holdings, including Alibaba (BABA), Uni-President (OTCPK:UPCHY), and Tencent (OTCPK:TCEHY) continued to disappoint despite continuing to trade at what we believe to be compelling valuations. As we mentioned earlier, we remained quite active in terms of portfolio activity in managed account portfolios over the last year. Including the previously mentioned stocks in this report, we established a plethora of new positions over the past year. Among others, this included a Dutch industrial conglomerate that sells mission critical products across a variety of end markets; a UK-based global provider of IT infrastructure services; a Japanese global provider of advertising services; a French-based global provider of business optimization, back office, and call center services; a French-based leader in the video gaming industry; a US-based provider of packaging solutions; a US-based truck and trailer rental and self-storage company; and a Hong Kong-based manufacturer of micromotors used in a variety of consumer and business product applications. All new additions, in our view, were purchased at prices that represented significant discounts from our estimates of their underlying intrinsic values, were financially strong, and had attractive runways for potential future growth. Additions were also made to a number of pre-existing positions. On the sell side, several holdings were sold or pared back. The stock prices of these businesses had either reached our estimates of their underlying intrinsic values or had been compromised in some way by virtue of declines in our estimates of their underlying intrinsic values and future growth prospects. Or, they may have been sold or trimmed to make room for new additions or to generate tax losses, which could be used to offset capital gains.
Final Thoughts
Imagine that in some private business you own a small share that cost you $1,000. One of your partners, named Mr. Market, is very obliging indeed. Every day he tells you what he thinks your interest is worth and furthermore offers either to buy you out or to sell you an additional interest on that basis. Sometimes his idea of value appears plausible and justified by business developments and prospects as you know them. Often, on the other hand, Mr. Market lets enthusiasm or his fears run away with him, and the value he proposes seems to you a little short of silly. If you are a prudent investor or sensible businessman, will you let Mr. Market’s daily communication determine your view of the value of a $1,000 interest in the enterprise? Only in the case you agree with him, or in case you want to trade with him. You may be happy to sell out to him when he quotes you a ridiculously high price, and equally happy to buy from him when his price is low. But the rest of the time you will be wiser to form your own ideas of the value of your holdings, based on full reports from the company about its operations and financial condition.
Benjamin Graham, The Intelligent Investor, Chapter 8 (the parable of “Mr. Market”)
The adjustment to a new world of structurally higher interest rates will likely not be easy for investors, and may very well be accompanied by a lot of “sturm und drang” in our capital markets. We have certainly seen evidence of this over the last two years. During times like these, Graham’s instructive parable about Mr. Market becomes, in our view, critically important. As Graham has counseled, the market is there to serve you, not to guide you. It offers the disciplined and intelligent investor the opportunity to take advantage when markets become unmoored. It requires independent thought, rigorous analysis, and in our humble view, business-like thinking. Simply put, it is an admonition that serves the interests of investors as opposed to speculators. Post the financial crisis of 2008, through 2021, we would contend that relatively free money primarily served the interests of speculators, not investors. If we are indeed on the flipside of that era, sound investment should once again serve the interests of intelligent investors. As you can imagine, we welcome the prospects afforded by this new era and will do our very best to seek to exploit the pricing opportunities that are presented to us.
Thank you for investing with us and for your continued confidence. We work hard to earn and keep your trust, and we believe it is critical to our mutual success.
Sincerely,
Roger R. de Bree, Andrew Ewert, Frank H. Hawrylak, Jay Hill,
Thomas H. Shrager, John D. Spears, Robert Q. Wyckoff, Jr.
|
A list containing all recommendations made by Tweedy, Browne Company LLC within the previous 12 months is available upon request. It should not be assumed that all recommendations made in the past have been profitable or that recommendations made in the future will be profitable or will equal the performance of the securities in this list. |
Editor’s Note: This article discusses one or more securities that do not trade on a major U.S. exchange. Please be aware of the risks associated with these stocks.