- Prior month 2.6% YoY revised to 2.7%
- Ex Food and energy MoM 0.0% vs 0.2% estimate
- Ex Food and energy YoY 2.4% vs 2.7% estimate. Prior month 3.0%
- Ex Food and Energy/Trade 3.3% vs 3.2% (revised from 3.1%
- Ex Food and Energy/Trade MoM 0.3% vs 0.1% last month (revised from 0.0%)
Final Demand for good and services
- Good +0.6%. This was the largest increase since 1.1% in February. Nearly 60% can be attributed to energy which moved up 1.9%
- Services -0.2%. This was a largest decline since March 2023. The decline can be attributed to final demand for trade services which fell -1.3%
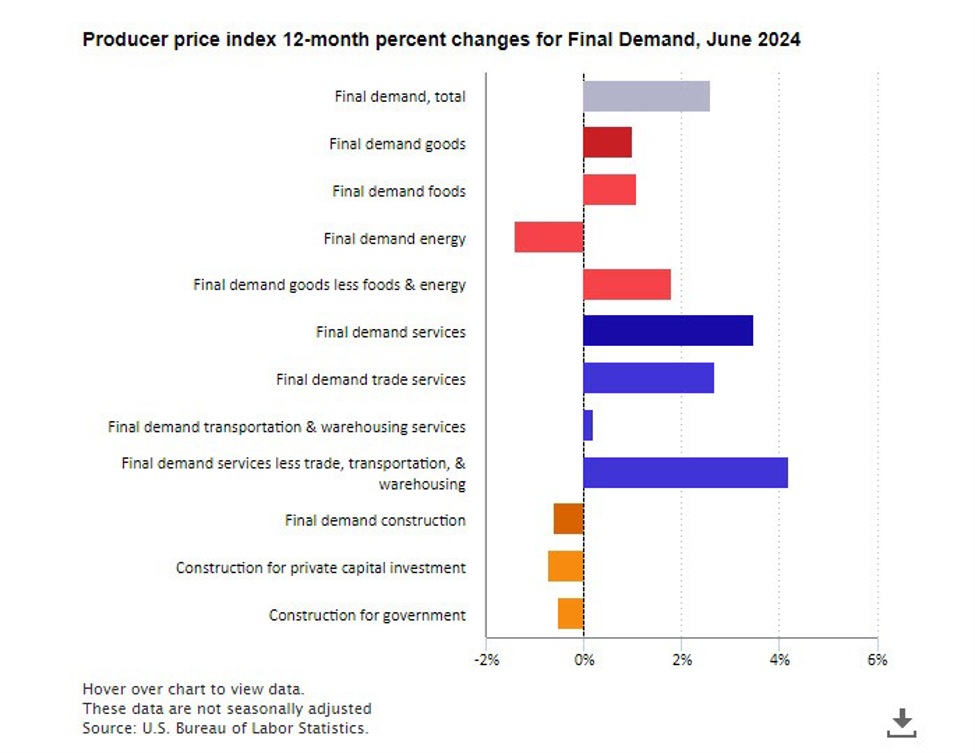
Final Demand Goods
- Prices increased 1.0% over the year.
- Final demand foods increased 1.1%.
- Final demand energy decreased 1.4%.
- Final demand goods less foods and energy increased 1.8%.
Final Demand Services
- Prices increased 3.5% over the year.
- Trade services prices increased 2.7%.
- Transportation and warehousing services prices were nearly unchanged at 0.2%.
- Services less trade, transportation, and warehousing increased 4.2%.
Final Demand Construction
- Prices decreased 0.6% over the year.
This article was written by Greg Michalowski at www.forexlive.com.