Initial jobless claims
- Prior week initial jobless claims 229 K
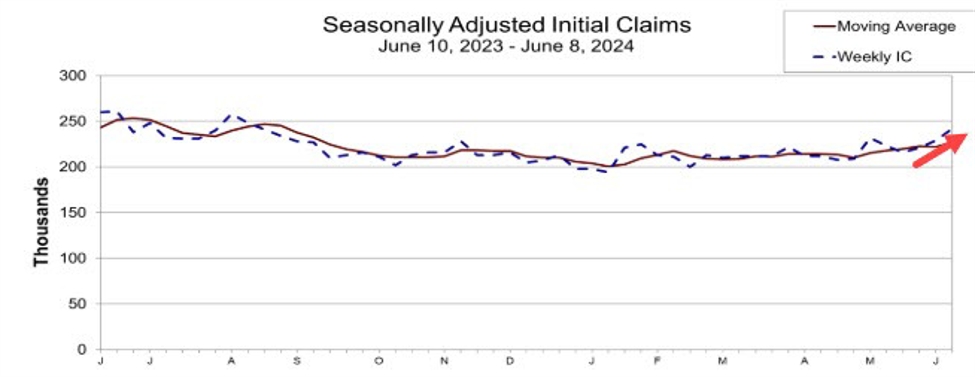
- Initial jobless claims 242K vs 220K estimate. Highest since August 2023
- 4-week moving average of initial jobless claims 227.00 versus 222.5K
- Prior week continuing claims 1.792M revised to 1.790M
- Continuing claims 1.820M vs 1.798M estimate. Highest since November 2021
- 4-week moving average continuing claims 1.797M vs 1.788M last week
- The largest increases in initial claims for the week ending June 1 were in Minnesota (+2,788), California (+1,974), Ohio
(+1,692), Pennsylvania (+1,566), and Florida (+784), - The largest decreases were in Michigan (-2,706), Texas
(-1,822), Tennessee (-1,295), New York (-1,016), and Georgia (-809).
The data is showing some weakness with the moves higher in both the initial and continuing claims. It makes you scratch your head about the BLS jobs report. Remember the household portion has been diverging with the non-farm payroll. While non-farm payroll rose 272K, the household survey showed a decline of around -400K.
WIth the combination with the PPI, the US stocks are higher with the S&P up 20 points now. The Nasdaq is up 160 points. Both are on pace for another record close.
Yields are now lower too.
Will the Feds shift to “trust, but verify” now lead the Fed to delay too long? Is the dot-plot already obsolete?