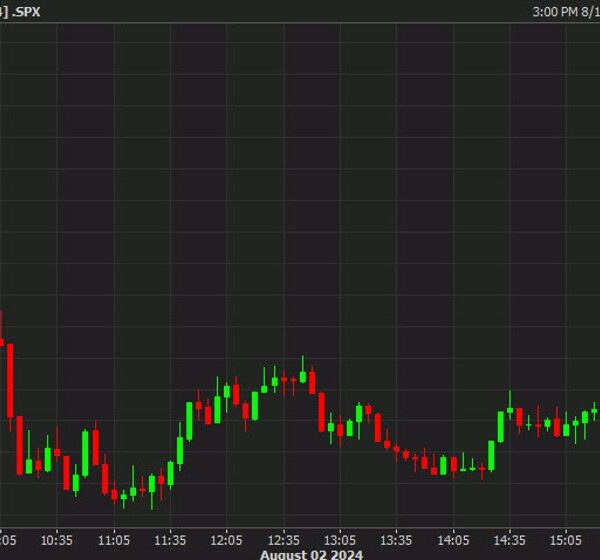
The NASDAQ index is hitting new intraday highs, currently up 134.13 points (+0.78%) at 17,300.82. In the process, it has broken above a key target level at 17,238, which had served as support in mid-March (March 11, 13, and 14 — see red circles). The index is also trading above the April 9 high of 17,202.94, further strengthening the bullish case.
Looking ahead, the next major resistance is the 50% Fibonacci retracement of the decline from the December high, which comes in at 17,494.31. Beyond that, though not shown on the chart, is the falling 50-day moving average, currently at 17,732.54.
The S&P 500 is also higher, up 23 points (+0.42%) at 5,507.90. Yesterday, it climbed above its 200-hour moving average at 5,457.12, and is now extending gains above the 50% retracement of its pullback from the all-time high reached on February 20. That level, at 5,491.24, now acts as short-term support. Holding above it could pave the way for further upside momentum. Staying above the 200-hour MA is a risk level for buyers looking for more upside.
ForexLive.com
is evolving into
investingLive.com, a new destination for intelligent market updates and smarter
decision-making for investors and traders alike.


