anyaberkut
If you’re looking for high-yield income vehicles with value and growth attributes, you may want to check out the Liberty All-Star® Equity Fund (NYSE:USA).
Fund Profile:
USA is a core equity holding that allocates its assets to three value style investment managers and two growth style investment managers.
Typically, value style managers focus on companies with attractive prospects but that trade at comparatively low multiples of earnings, revenue, and book value. Growth style managers generally concentrate on companies with high expected sales and earnings growth that are leaders in expanding sectors of the economy.
USA’s board appointed Westfield Capital Management Company, L.P. as one of the Fund’s investment managers in June 2024. Westfield will assume management of the Fund’s assets currently allocated to SustainableGrowth Advisers.
USA has a long history — it began trading in 1986. With $1.91B in assets, it’s one of the top 10 largest equity CEFs. Its 752K in average daily volume ranks in the top 5 for equity CEFs. Its expense ratio is 0.93%, and it uses minimal leverage, at 1.03%. It had 150 holdings, as of 3/31/24.
Dividends:
USA’s current distribution policy is to pay distributions on its shares totaling approximately 10% of its net asset value/year. These are payable in four quarterly installments of 2.5% of the Fund’s net asset value at the close of the NYSE on the Friday before each quarterly declaration date.
At its 9/6/24 closing price of $6.75, USA’s forward dividend yield was 10.67%. It should go ex-dividend next on ~11/15/24, with a ~1/2/25 pay date.
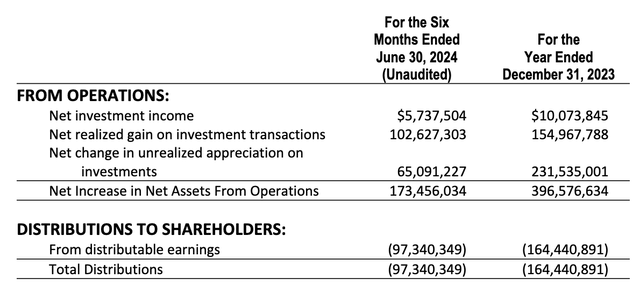
For the 6 months ended 6/30/24, NII and Net Realized Gains covered distributions by a 1.11X factor, up vs. the 1X coverage for 2023:
Taxes:
USA’s 2023 payouts were characterized as 88% long term capital gains, with no Return of Capital, and 11.28% qualified dividends:
Holdings:
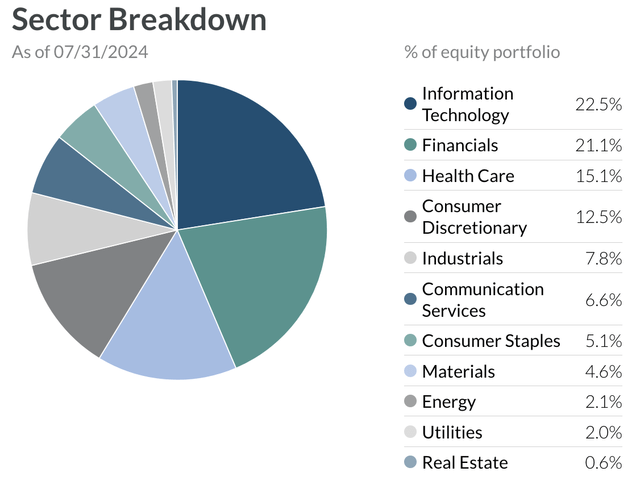
As of 7/31/24, Tech was USA’s biggest exposure, at 22.5%, up from 21.2% on 3/31/24. The top 4 sectors — Tech, Financials, Health Care, and Consumer Discretionary, comprised ~71% of its portfolio, as of 7/31/24:
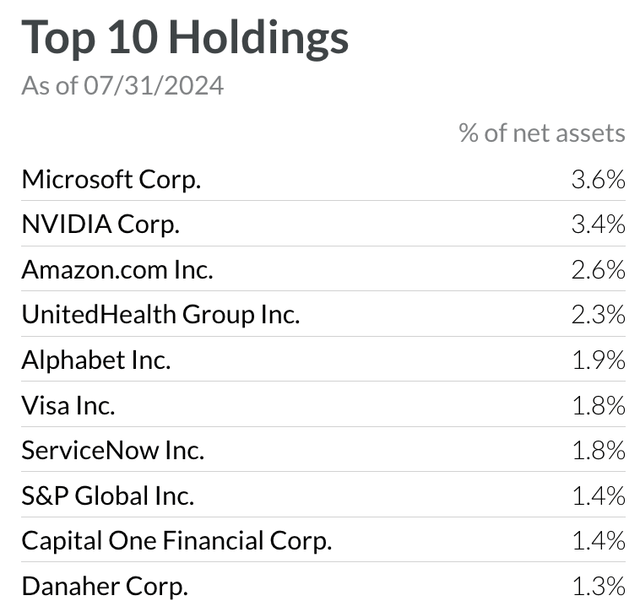
USA’s top 10 holdings formed 21.5% of its portfolio, as of 7/31/24. Capital One and Danaher replaced Charles Schwab and Salesforce in the top 10 in Q2 ’24.
Risks:
Risks to investing in the USA fund are listed on pages 29-29 in its semi-annual report. Market, common stock, foreign currency, market disruption, and geopolitical risk are among the types of risk covered in that document.
Performance:
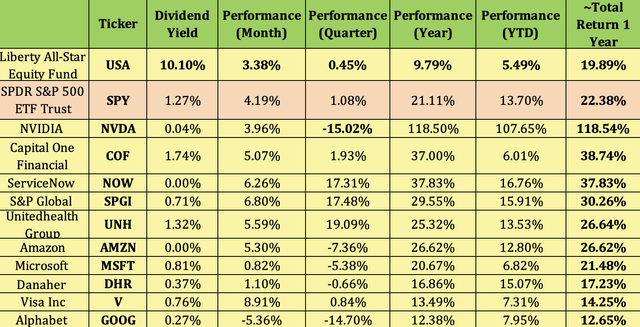
USA has lagged the S&P 500 (SP500) over the past year by ~ 250 basis points, on a total return basis. However, considering the fact that its objective is to provide attractive income, its ~10% trailing yield is much more attractive to income investors than the S&P’s 1.27% yield.
Looking at USA’s top 10 holdings’ performance over the past year, Nvidia was the leader by far, riding the AI wave to a 118% return. Capital One, ServiceNow, and S&P Global all returned over 30%.
ServiceNow uses AI to provide workflow automation platforms for digital businesses. Capital One and S&P Global are both Financials, which is the top-performing sector over the past year, at ~27%, vs. ~26% for Tech.
UnitedHealth, Amazon and Microsoft all returned over 21% over the past year, while Danaher, Visa, and Alphabet returned ~12% to ~17%.
Value stocks, which nominally account for 60% of USA’s assets, strongly underperformed growth stocks in the 1st half of 2024. Also, USA’s greater diversity meant it could not keep pace with exceptional returns for information technology stocks, especially the semiconductor stocks.
As of 7/31/24, USA’s 20-year annualized price performance of 8.95% is ~110 basis points below that of the Lipper Large Cap Core Index; whereas it outperformed the index over the past 10- and 15-year periods. The biggest price underperformance figures were in the past 1- and 3-year periods.
Valuations:
A useful strategy when buying CEF’s is to try to buy them at deeper discounts or lower premiums than their historical averages, due to mean reversion. NAV is measured after the market close.
“Relative to their underling NAV, Fund shares traded during the second quarter in a range from a 0.4% premium to a 4.3% discount. For the first half of 2024, the trading range extended from a 0.4% premium to a 5.8% discount.” (USA site)
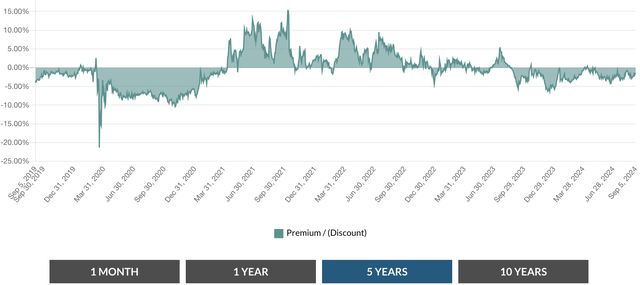
At its 9/5/24 closing price, USA was selling a discount to NAV/share of 1.73%, a deeper discount than its 3- and 5-year average price/NAV of 0.75% and -0.54%, but not as deep as its 1-year average price/NAV of -2.51%.
After plummeting, like every other asset, during the COVID-19 breakout in 2020, USA bounced back to mostly selling at premiums in 2021-2022. It began selling at discounts to NAV in ~Q3 ’23, and has mostly continued to do so in 2024.
Parting Thoughts:
We rate USA a Buy, based upon its attractive dividend yield, its exposure to Financials and Tech, and its discount to NAV. In this volatile month, you may be able to achieve an entry price with an attractive discount to NAV.
All tables furnished by Hidden Dividend Stocks Plus, unless otherwise noted.


