Fundamental
Overview
The USD last week finished
slightly positive but overall, it was a pretty flat week. We got some great US PMIs on Friday which showed growth without
inflationary pressures. In fact, despite the strong PMIs the market pricing for
interest rates remained unchanged. That should be generally positive for risk
sentiment going forward.
The CAD, on the other hand,
has been gaining ground against the greenback probably on the back of the
better risk picture. Today, we have the Canadian CPI data and that will definitely
move the Loonie. The market is already pricing around 65% chance of another BoC
rate cut in July and today’s data might seal those expectations.
That could weigh on the CAD
in the short term, but it might still appreciate due to the positive risk
sentiment. Stronger inflation figures, on the other hand, should give the
Loonie a boost but it might not be enough to trigger a breakout of the range.
USDCAD
Technical Analysis – Daily Timeframe
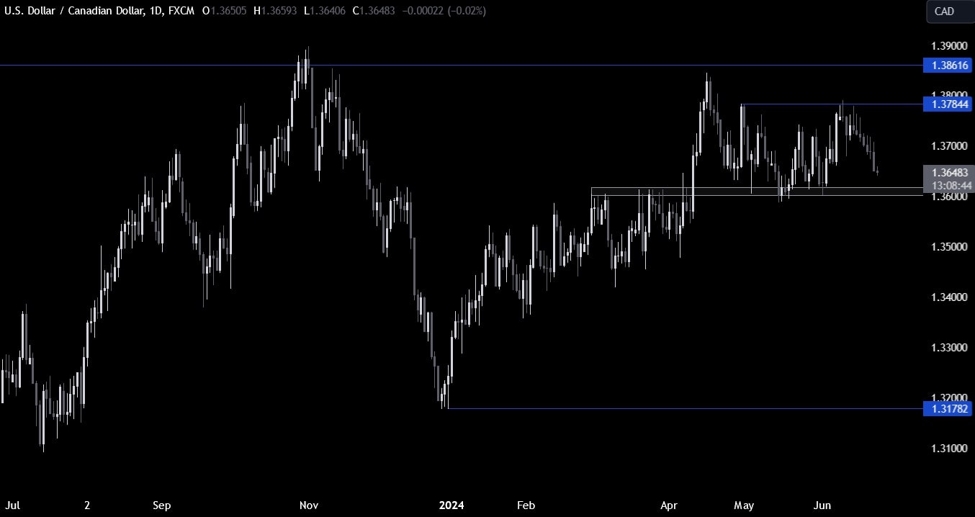
USDCAD Daily
On the daily chart, we can
see that USDCAD is falling back to the key support
zone around the 1.36 handle. That’s where we can expect the buyers to step in with
a defined risk below the support to position for a rally back into the 1.3785
resistance. The sellers, on the other hand, will want to see the price breaking
out to the downside to pile in more aggressively and target a drop into the
1.34 handle next.
USDCAD Technical
Analysis – 4 hour Timeframe
USDCAD 4 hour
On the 4 hour chart, we can
see more clearly the rangebound price action between the 1.36 support and the
1.3785 resistance. We got a break below the 1.3680 level yesterday which
triggered some more selling pressure as the key support zone becomes kind of a
magnet for the market. There’s not much to do here other than waiting for the
price to reach the key levels.
USDCAD Technical
Analysis – 1 hour Timeframe
USDCAD 1 hour
On the 1 hour chart, we can
see that we have a downward trendline
adding some extra resistance to the 1.3680 level. If we see a pullback into the
resistance today, that’s where we can expect the sellers to pile back in with a
defined risk above the trendline and position for a break below the 1.36
support zone with a better risk to reward setup.
The buyers, on the other
hand, will want to see the price breaking above the trendline to turn the bias
more bullish and position for a rally back into the 1.3785 resistance. The red
lines define the average daily range for today.
Upcoming
Catalysts
Today we have the Canadian CPI data and the US Consumer Confidence report. On
Thursday, we get the latest US Jobless Claims figures, while on Friday we
conclude the week with the Canadian GDP and the US PCE report.