Fundamental
Overview
The USD yesterday was sold
across the board following the soft US CPI report. The data made the market to price back
in two cuts for this year. Later in the day though we got a bit more hawkish
than expected FOMC decision where the dot plot showed that the Fed sees just one cut for this
year despite the soft US CPI report.
This gave the greenback a
boost, but Fed Chair Powell backpedalled on the projections making them a
bit less worrying as the central bank remains very data dependent. So, all in
all, the US Dollar might still come under pressure as the risk sentiment should
improve thanks to the soft US CPI.
The CAD, on the other hand,
has been a bit under pressure as the Bank of Canada delivered a slightly more dovish
cut than expected. Overall, the central bank said that they remain data
dependent and the rate cuts expectations didn’t change much.
If we go back into risk-on
sentiment, the CAD might appreciate amid a general US Dollar weakness.
USDCAD
Technical Analysis – Daily Timeframe
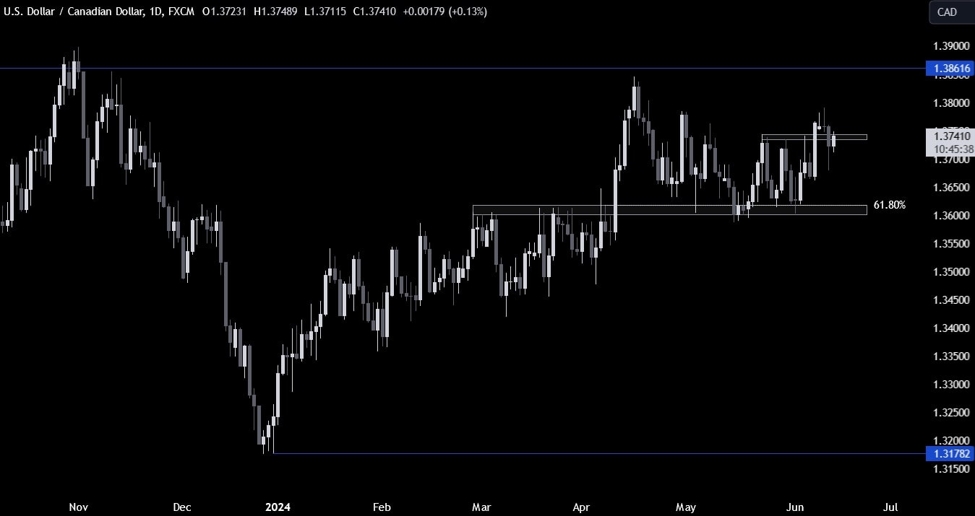
USDCAD Daily
On the daily chart, we can
see that USDCAD fell back inside the range following the soft US CPI report and
then pulled back to retest the support-turned-resistance on a more hawkish than expected
FOMC decision.
This is where we can expect
the sellers to step in with a defined risk above the resistance to position for a drop back into
the 1.36 support. The buyers, on the other hand, will want to see the price
rallying back above the resistance to regain some conviction and target a break
above the 1.38 handle.
USDCAD Technical
Analysis – 4 hour Timeframe
USDCAD 4 hour
On the 4 hour chart, we can
see more clearly the drop on the US CPI and then the move back up on the FOMC
decision. There’s not much more to add here as the sellers will look for a drop
from the resistance, while the buyers will look for a breakout to the upside to
keep targeting new highs.
USDCAD Technical
Analysis – 1 hour Timeframe
USDCAD 1 hour
On the 1 hour chart, we can
see that the price yesterday has also broke below the recent trendline that was defining the bullish trend
from the 1.36 support. If the price were to fall below the 1.3710 level, the
sellers will have another confirmation that the bearish momentum could pick up
steam. The red lines define the average daily range for today.
Upcoming
Catalysts
Today we have the US PPI and the latest US Jobless Claims
figures. Tomorrow, we conclude the week with the University of Michigan
Consumer Sentiment survey.