Fundamental
Overview
The USD yesterday came
under renewed pressure following the beat in the US ISM Services PMI where the data showed that the last
month drop was just a blip and overall we have a resilient economy with lower inflationary
pressures. The data continues to reinforce the narrative that the next move is
more likely to be a rate cut, and that inflation is likely to keep coming back
to target. This could keep weighing on the greenback as the positive risk
sentiment due to the pickup in global growth is generally a headwind.
The CAD, on the other hand,
came a bit under pressure yesterday as the Bank
of Canada delivered a slightly more dovish cut than expected as they
signalled that more rate cuts could be on their way if inflation continues to
ease. Overall though, the central bank said that they remain data dependent and
the rate cuts expectations didn’t change much as the market is seeing 77 bps of
easing in total this year vs. 60 bps before the rate decision.
USDCAD
Technical Analysis – Daily Timeframe
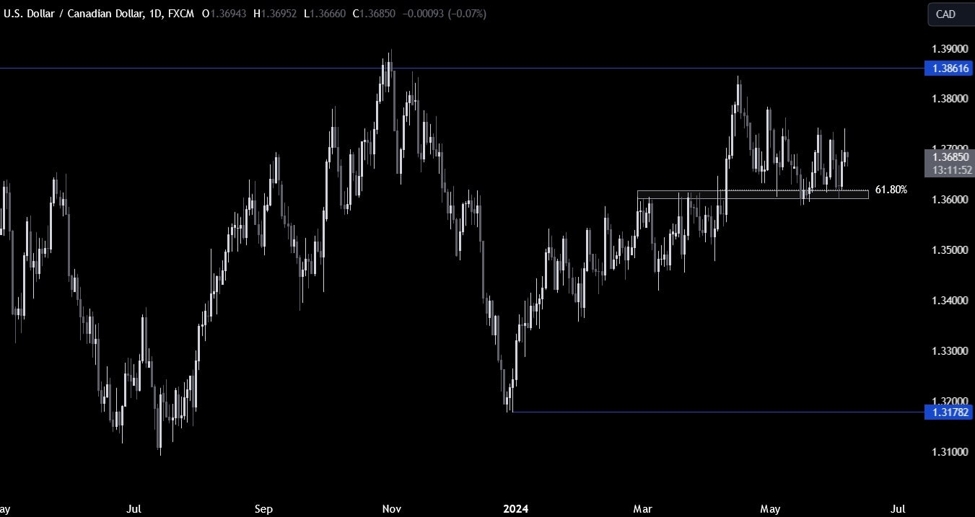
USDCAD Daily
On the daily chart, we can
see that USDCAD yesterday spiked into the recent swing high at 1.3740 and
erased the move soon after. Overall, the pair remains confined in the range
between the 1.36 support
and the 1.3740 resistance. We will likely need a break on either side to get a
more sustained trend. For now, the market participants might keep on “playing
the range” by buying at support and selling at resistance.
USDCAD Technical
Analysis – 4 hour Timeframe
USDCAD 4 hour
On the 4 hour chart, we can
see more clearly the range with the price now trading right in the middle of
it. From a risk management perspective, late sellers would be better off waiting
for the price to come back to the resistance to position for a drop into the
support. The buyers, on the other hand, will want to wait for the price to come
back into the support to position for a rally into the resistance.
USDCAD Technical
Analysis – 1 hour Timeframe
USDCAD 1 hour
On the 1 hour chart, we can
see that we have a strong level at 1.3666 where the price reacted from several
times in the past days. This level could act as kind of barometer for the
sentiment with the price trading below it being more bearish and above it being
more bullish. The red lines define the average daily range for today.
Upcoming
Catalysts
Today we get the latest US Jobless Claims figures, while tomorrow we conclude
the week with the Canadian Jobs data and the US NFP report.