Fundamental
Overview
The USD has been rallying
steadily against most major currencies in the recent couple of weeks, although the
catalyst behind the move has been unclear. A good argument has been that most
of the moves we’ve been seeing in the past 10 trading days were driven by
deleveraging from strengthening Yen.
Basically, the squeeze on
the carry trades impacted all the other markets. Given the magnitude of the
recent appreciation in the Yen and the correlation with many other markets, it
looks like this could be the reason indeed.
From the monetary policy
perspective, nothing has changed as the market continues to expect at least two
rate cuts by the end of the year and sees some chances of a back-to-back cut in
November.
The data continues to
suggest that the US economy remains resilient with inflation slowly falling
back to target. Overall, this should continue to support the soft-landing
narrative and be positive for the general risk sentiment.
The CAD, on the other hand,
has been supported against the US Dollar in the past months mainly because of
the risk-on sentiment, although the recent events with the Yen boosted the US
Dollar against many major currencies. On the monetary policy front, the BoC
cut rates by 25 bps to 4.50% as expected last week signalling more to come
if inflation were to keep falling.
USDCAD
Technical Analysis – Daily Timeframe
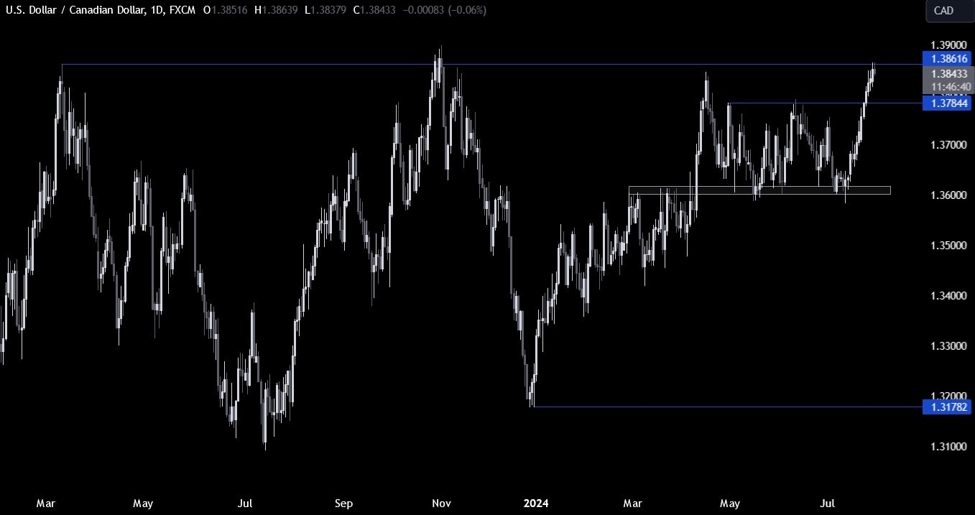
USDCAD Daily
On the daily chart, we can
see that USDCAD eventually managed to break above the 1.3785 resistance zone and extended the rally into
the key 1.3860 level. This is where we can expect the sellers to step in with a
defined risk above the level to position for a drop back into the 1.36 support.
The buyers, on the other hand, will want to see the price breaking above the
resistance to increase the bullish bets into the 1.40 handle next.
USDCAD Technical
Analysis – 4 hour Timeframe
USDCAD 4 hour
On the 4 hour chart, we can
see that we have a trendline defining the bullish momentum. The
buyers will likely keep on leaning on the trendline to target a break above the
resistance. The sellers, on the other hand, will want to see the price breaking
below the trendline to increase the bearish bets into the 1.36 support.
USDCAD Technical
Analysis – 1 hour Timeframe
USDCAD 1 hour
On the 1 hour chart, we can
see that if the price were to fall below the trendline, the buyers will have
another opportunity to step in around the previous resistance
now turned support at 1.3785. A further break below that support will
likely see the bearish momentum increasing with the sellers piling in for a
drop into the 1.36 support. The red lines define the average daily range for today.
Upcoming
Catalysts
Today we have the US Job Openings and the US Consumer Confidence reports. Tomorrow,
we have the BoJ Policy Decision, the Canadian GDP, the US Employment Cost Index
and the FOMC Policy Decision. On Thursday, we get the latest US Jobless Claims
figures, the Canadian Manufacturing PMI and the US ISM Manufacturing PMI.
Finally, on Friday, we conclude the week with the US NFP report.