The
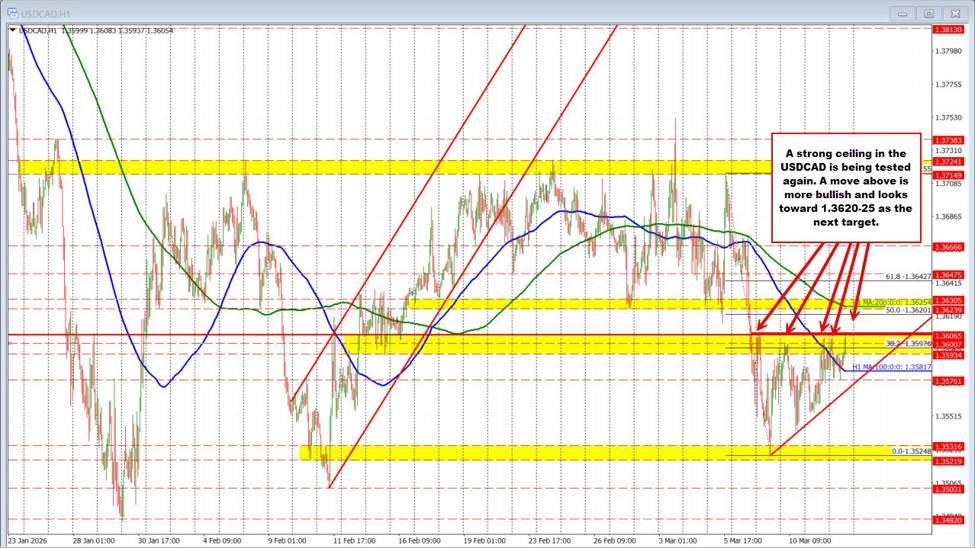
The USDCAD is pressing higher in North American trading and once again testing a key topside ceiling that has capped the pair all week. That resistance zone has become increasingly well defined, which makes the current test especially important from a technical perspective.
Looking back over the week, the high price on Monday reached 1.36065, Tuesday’s high came in at 1.36007, and Wednesday’s high stalled at 1.36050. Today’s rally has now taken the price right back to 1.36065, matching the week’s high. When a market repeatedly tests the same level and fails, that area becomes an important barometer for buyers and sellers. It tells traders that sellers are active there, but it also tells us that buyers are not giving up. The more a level is tested, the more meaningful the eventual break can become.
If buyers are able to push and hold above 1.36065, it would signal that this week’s ceiling has finally given way. That break should then increase bullish momentum and shift the focus toward the 50% retracement of the move down from last Thursday’s high at 1.3620, followed closely by the falling 200-hour moving average at 1.36254. Those levels represent the next important upside targets. A move above that zone would be even more significant because it would take the pair back into the broader consolidation range that has defined much of the trading action since mid-February.
That broader range has largely been confined between 1.3624 and 1.37241, roughly a 100-pip band that has contained price action for nearly three weeks. So, if buyers can break above the weekly ceiling and then clear the 200-hour moving average, it would suggest the market is regaining ground within that larger consolidation structure and could encourage a more sustained upside correction.
On the other hand, if sellers once again defend the 1.36065 ceiling and force the price lower, attention will turn back to nearby support levels. The first downside target comes in at 1.35934, and below that traders will be watching the 100-hour moving average at 1.35817. Beneath that, a rising trend line near 1.3570 becomes a key technical support level. If the price breaks below that trend line, it would weaken the bullish bias from the recent recovery and open the door for a deeper rotation lower.
In that bearish scenario, traders would likely begin to look back toward the weekly low near 1.35248. A move to that level would not be out of the question if upside momentum fails and sellers regain firm control below the trend-line support.
In the video above, I break down the key resistance ceiling at 1.36065, explain why that level has become so important after repeated tests during the week, and outline the next upside and downside targets that could shape the next move in USDCAD.