The USDCAD is seeing a modest pullback after Canadian GDP data showed growth in July — the first monthly rise in four months. The data gave the CAD a brief lift, leading to some correction in the pair.
From a technical perspective, the decline has taken the price back toward the broken 38.2% retracement of the move down from the March high to the mid-June low, which comes in at 1.39235. This level has been an important one for the pair: it stalled the rally back on August 25, but was finally broken yesterday with strong upside momentum. That break opened the door for a move higher, with the pair extending to today’s peak at 1.3958.
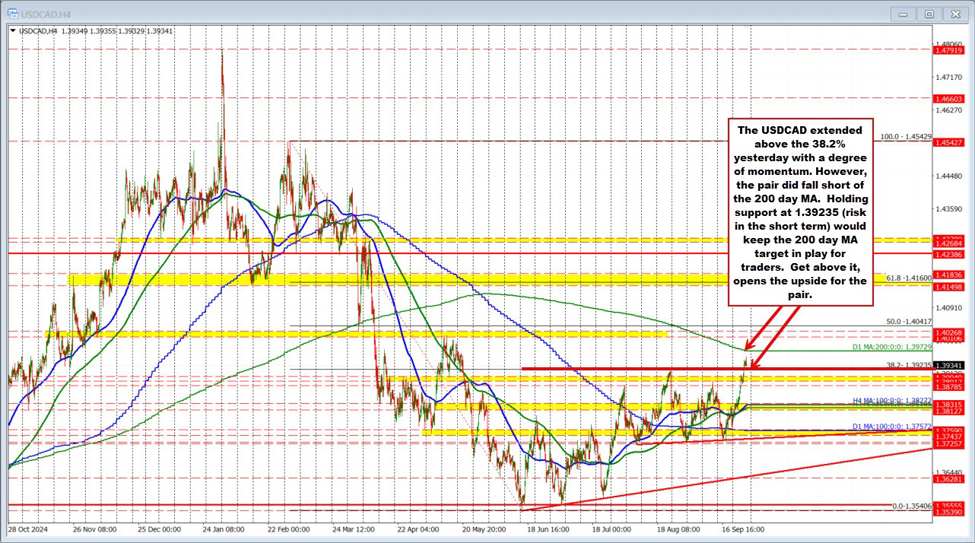
Despite the bullish push, the rally fell just short of a more critical resistance — the 200-day moving average at 1.39729. This level hasn’t been breached since April and continues to act as a key topside barrier. For buyers, the near-term outlook remains tilted to the upside as long as the 38.2% retracement at 1.39235 holds as support. But for a more decisive shift in control, traders will want to see a clean break above the 200-day moving average.
In the video above, I walk through these technical levels in detail and explain why they matter for both short-term bias and the broader trend in USDCAD.