The USDCAD has exhibited fluctuating trading patterns this week, continuing a trend seen since April. Since then, the pair has mostly oscillated between 1.3600 and 1.3800, with frequent ups and downs.
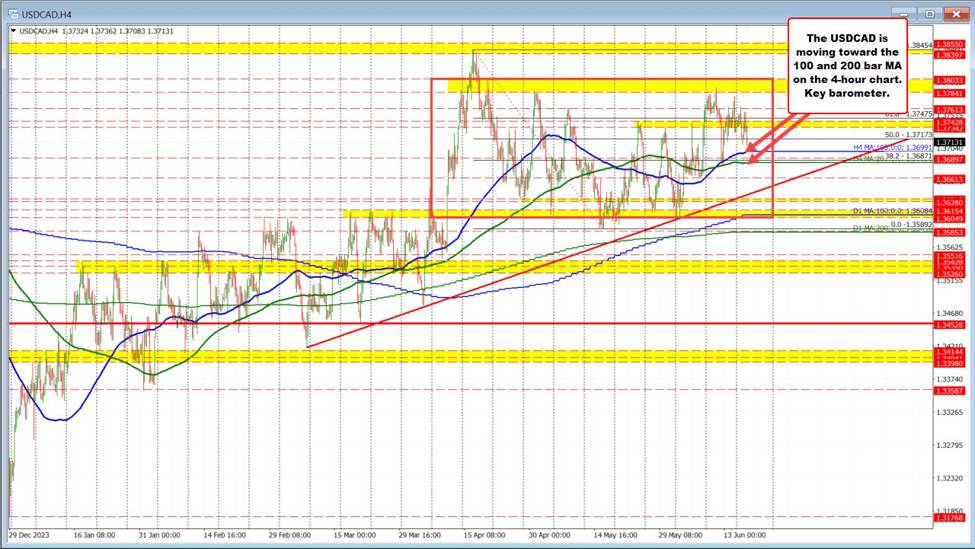
This week mirrors that pattern, with the price moving lower today and approaching the 100 and 200 bar moving averages (MAs) on the 4-hour chart. The 100-bar MA is at 1.3699, while the 200-bar MA is at 1.3686 (see blue and green lines on the chart below). These MAs will serve as critical indicators for both buyers and sellers. Staying above these levels would indicate a more bullish trend, as seen last week when the price tested these MAs and bounced.
Conversely, moving below these MAs would suggest a shift in trading bias towards the sellers. Despite this, it’s important to remember that the pair has been non-trending, marked by up and down movements. The MAs are positioned in the middle of the “red box” (see chart below), indicating that the price action isn’t breaking out yet. However, the bias could shift until the price decisively moves outside the “red box” and breaks the current pattern.
USDCAD moves toward 100/200 bar MA on 4-hour chart