Fundamental
Overview
The USD remains on the
backfoot as the US data continues to point to resilient growth with falling
inflation. This week, we got a good US Retail Sales report suggesting that the stories
of deteriorating consumer spending have been exaggerated. Overall, this should
continue to support the soft-landing narrative and be positive for the risk
sentiment.
The JPY in this environment
should keep losing ground against the major currencies and the Japanese
officials can’t do much to reverse the trend unless the fundamentals change. Yesterday,
the price broke through a key trendline and triggered a quick move lower in the
USDJPY pair probably due to stops getting triggered.
Overall, the Yen will
likely need weak US growth data to see some sustained strength on recessionary
fears and more aggressive rate cuts expectations. But as long as we have stable
global growth and generally positive risk sentiment, the JPY should remain in a
downtrend.
USDJPY
Technical Analysis – Daily Timeframe
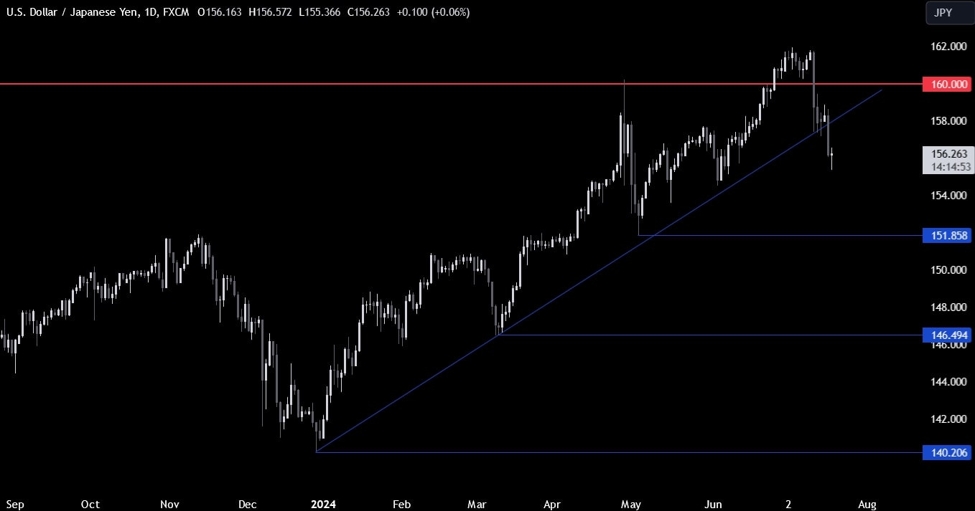
USDJPY Daily
On the daily chart, we can
see that USDJPY broke through the key trendline around the 158.00 handle and saw an
increase in the bearish momentum as the sellers piled in and the buyers had to
square their positions. Technically, the next target should be the 152.00 level
where we will likely find the buyers stepping in to position for a new cycle
high. For now, the sellers remain in control.
USDJPY Technical
Analysis – 4 hour Timeframe
USDJPY 4 hour
On the 4 hour chart, we can
see that we have a good resistance zone around the 157.00 handle where
we can find the confluence of the minor downward trendline and
the Fibonacci retracement levels.
This is where we can expect
the sellers to step in with a defined risk above the trendline to position for
a drop into the 152.00 level with a better risk to reward setup. The buyers, on
the other hand, will want to see the price rising back above the 158.00 level
to regain control and position for a rally into a new cycle high.
USDJPY Technical
Analysis – 1 hour Timeframe
USDJPY 1 hour
On the 1 hour chart, we can
see more clearly the bearish setup around the trendline. The white lines define
the average daily range for today.
Upcoming
Catalysts
Today we get the latest US Jobless Claims figures, while tomorrow we conclude
the week with the Japanese CPI data.