Fundamental
Overview
The JPY eventually increased
the gains following the BoJ
rate hike as Governor Ueda delivered some hawkish
comments during the press conference.
On Wednesday, we had the FOMC
rate decision and as expected it was a dovish one. Fed Chair Powell hinted
to a September rate cut and didn’t even close the door for “several” rate cuts
before the end of the year.
Yesterday, we got some general
risk-off in the markets which was triggered by an ugly US
ISM Manufacturing PMI release. The market has now fully priced in three
rate cuts by the end of the year for the Fed and continues to raise the chances
of a 50 bps cut in September.
For those bullish on the
pair, this might open an unwinding opportunity if the aggressive rate cuts get
priced out like we saw in Q1 2024 and if the data from Japan remains
weak enough
to end the BoJ hopes for further rate hikes.
USDJPY
Technical Analysis – Daily Timeframe
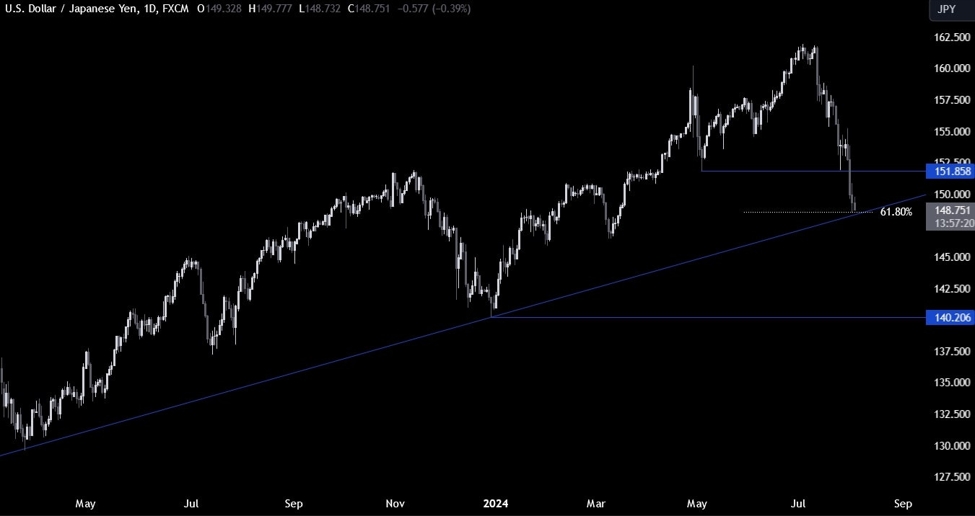
USDJPY Daily
On the daily chart, we can
see that USDJPY reached the key trendline
around the 148.50 level where we can also find the 61.8% Fibonacci
retracement level for confluence.
This is where we can expect the buyers to step in with a defined risk below the
trendline to position for a new cycle high. The sellers, on the other hand,
will want to see the price breaking lower to increase the bearish bets into the
next support
around the 140.00 handle.
USDJPY Technical
Analysis – 4 hour Timeframe
USDJPY 4 hour
On the 4 hour chart, we can
see that we have a downward trendline defining the current bearish momentum.
From a risk management perspective, the sellers will have a better risk to
reward setup around the 152.00 level where they will find the confluence of the
previous swing low, the 50% Fibonacci retracement level and the trendline. The
buyers, on the other hand, will want to see the price breaking above those
levels to regain control and increase the bullish bets into new highs.
USDJPY Technical
Analysis – 1 hour Timeframe
USDJPY 1 hour
On the 1 hour chart, we can
see that we have another minor trendline. The sellers will likely keep on
leaning on it to position for a break below the major trendline. The buyers, on
the other hand, will want to see the price breaking higher to increase the
bullish bets into the 152.00 resistance. The red lines define the average daily range for today.
Upcoming
Catalysts
Today we conclude the week with the US NFP report where the consensus expects
175K jobs added in July and the Unemployment Rate to remain unchanged at 4.1%.