murat4art
It is volatility dispersion season as corporate earnings in mid-July quickly approach. Implied volatility levels for the top components of the S&P 500 (SP500, SPX) are rising as the 1-month implied correlation index sinks to an all-time low as of this writing.
The 1-month implied correlation index measures the implied volatility of the S&P 500 Index and the top 50 component options. When the index rises, it suggests that implied volatility is moving in the same direction as the components and the S&P 500 index. When the correlation index is low, it tells us that correlations in the market are low and implied volatility levels are going in opposite directions.
Volatility Dispersion
Currently, we are seeing the 1-month at the money implied volatility levels for stocks like Apple (AAPL), Microsoft (MSFT), Alphabet (GOOGL), Amazon (AMZN), Tesla (TSLA), Meta (META), and Nvidia (NVDA) all moving higher, with earnings from these companies due in just a couple of weeks.
Bloomberg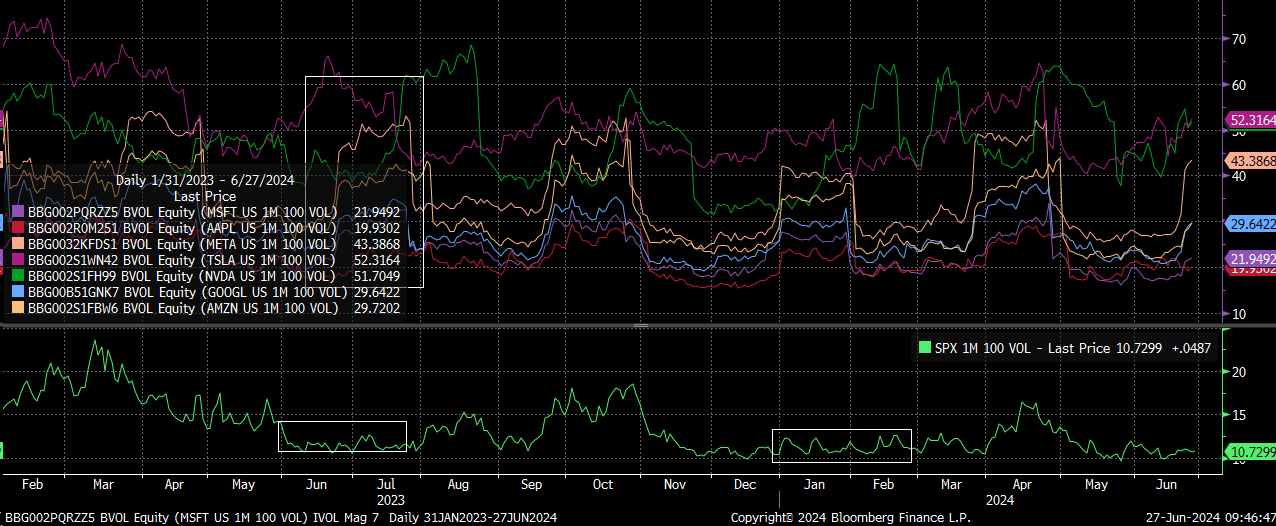
Typically, this trade works by selling an S&P 500 call option, buying the underlying call options, and then delta hedging the position by buying the underlying stocks. We saw the same trade last year, which peaked right in the middle of July. It was the unwinding of that trade that ultimately started a period of heightened volatility for the equity market, which concluded in October.
This trade has pushed the 1-month implied correlation index to its lowest levels since the level seen in 2018 just before the “Volamagdden” January move lower in the stock market. Because this index is already at its all-time lows, it makes the odds of it continuing to push lower even harder.
Bloomberg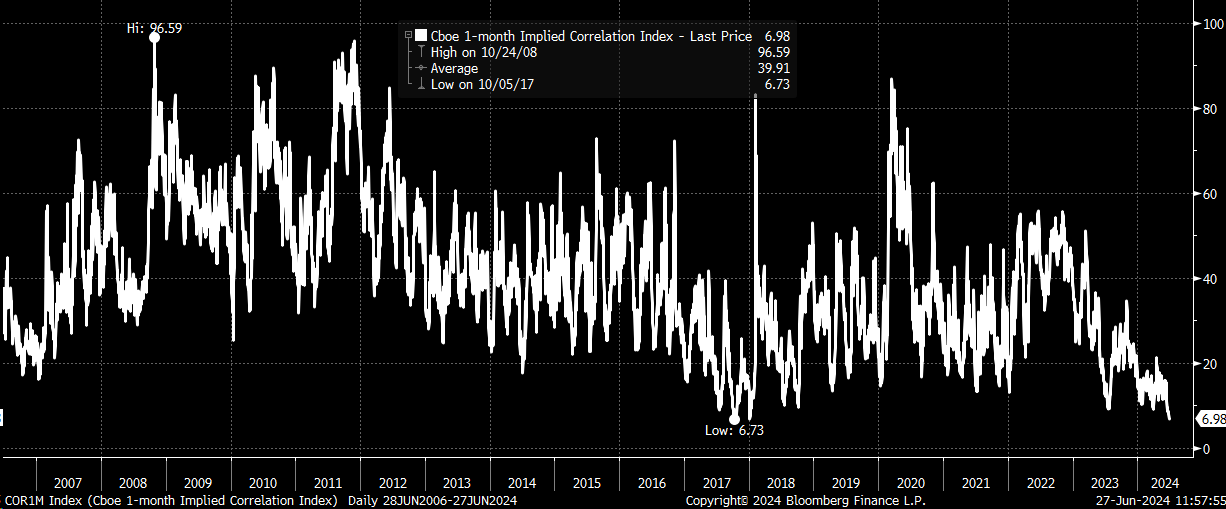
Implied and Realized Volatility
It will require S&P 500 implied volatility levels to move even lower from the S&P VIX Index’s (VIX) current level of 12.5, and that may not be so easy to do because this has been the lower end of the trading for the VIX now for some time. Returning to 2019, the region around 12 has survived as the lower bound for the VIX index.
Bloomberg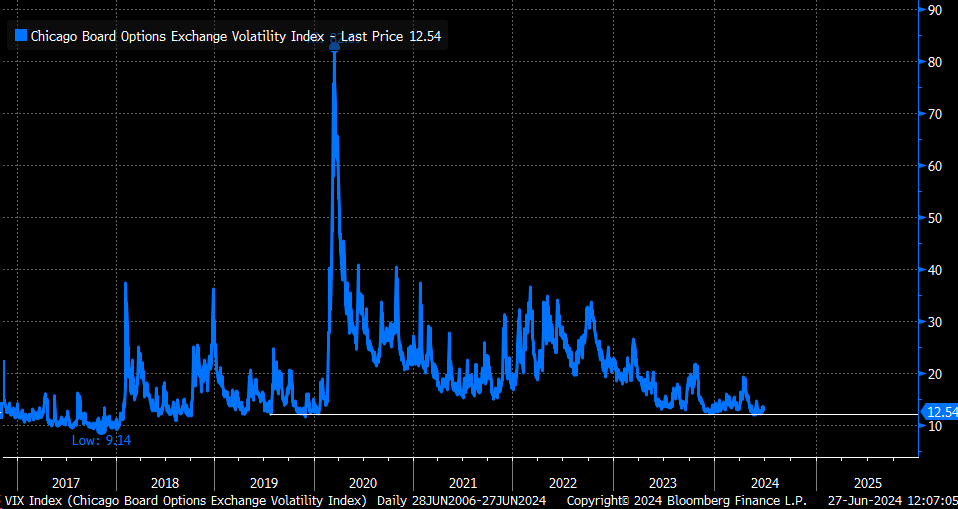
Additionally, 30-day realized implied volatility levels are already down at 7.3%, which is again at the very low end of realized volatility levels since 2017, again just before the January 2018 market breakdown. It suggests that it will be tough to get realized volatility even lower from current levels unless we continue to see days when the S&P 500 can trade in a tight range.
Bloomberg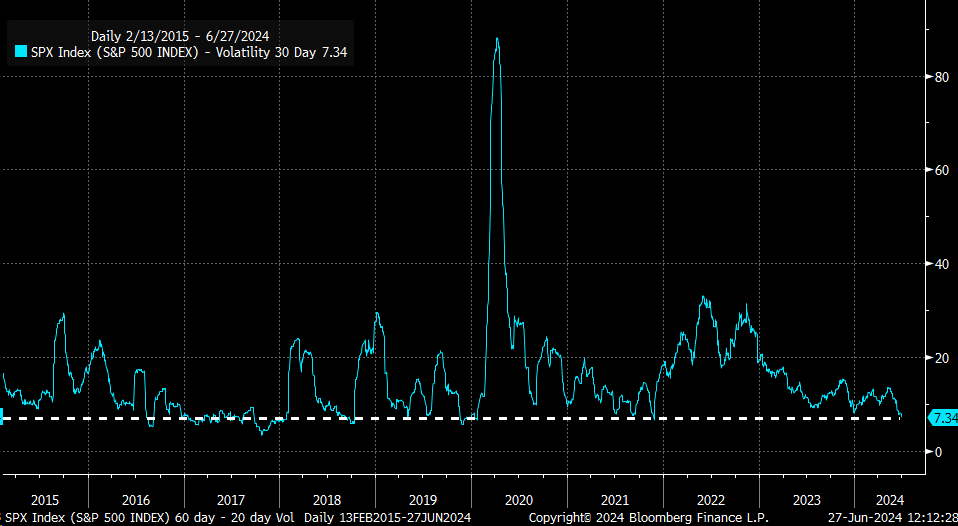
The “Rule of 16”
The “Rule of 16” suggests that the VIX will increase if the S&P 500 rises or falls by more than 80 bps. Meanwhile, the same rule of 16 indicates that if the S&P 500 rises or falls by more than 50 bps, 30-day realized volatility will have to start rising.
Again, this isn’t to imply that the S&P 500 cannot continue to trade in a tight range, but the odds seem heavily stacked against this type of environment-continuing over the longer term.
Seemingly, it may make it tough for the volatility dispersion to keep working and that a sudden market shift or expansion of volatility from these very low levels would cause it to unwind.
If volatility levels started from much higher levels, the trade could extend for some time, as it did in June and July 2023. But this year, volatility levels seem too low for this trade to last for an extended time.
Generally speaking, the S&P 500 index and the 1-month implied correlation index move inversely. So, a rising implied correlation index would signal that the S&P 500 should be moving lower. Meanwhile, if the 1-month implied correlation index is rising, and the S&P 500 is rising too, it is probably the best indication that something in implied volatility is changing, and can serve as a warning sign that the trade is due to unwind.