Urupong/iStock via Getty Images
Our results are detailed in the table below. As we have often said, we place no weight on short-term results, good or bad. When we think we can improve our prospective long-term returns and lower risk, we will make those decisions without regard to their effect on short-term performance.
|
INVESTMENT STRATEGY |
QTD |
YTD |
Annualized Since Inception* |
|
Large Cap Composite (Gross) |
4.7% |
10.0% |
10.6% |
|
Large Cap Composite (Net) |
4.6% |
9.5% |
9.8% |
|
Russell 1000 Value Index |
5.3% |
11.7% |
7.6% |
|
S&P 500 Index |
8.1% |
14.8% |
10.9% |
|
Small Cap Composite (Gross) |
4.3% |
6.6% |
8.3% |
|
Small Cap Composite (Net) |
4.1% |
6.1% |
7.3% |
|
Russell 2000 Value Index |
12.6% |
9.0% |
6.5% |
|
Russell 2000 Index |
12.4% |
10.4% |
7.7% |
|
Focus Composite (Gross) |
3.8% |
7.3% |
14.5% |
|
Focus Composite (Net) |
3.7% |
7.0% |
13.5% |
|
Russell 1000 Value Index |
5.3% |
11.7% |
7.9% |
|
S&P 500 Index |
8.1% |
14.8% |
10.9% |
|
Focus Plus Composite (Gross) |
3.8% |
7.2% |
14.1% |
|
Focus Plus Composite (Net) |
3.7% |
6.1% |
12.9% |
|
Russell 1000 Value Index |
5.3% |
11.7% |
7.6% |
|
S&P 500 Index |
8.1% |
14.8% |
10.9% |
|
All Cap Composite (Gross) |
5.7% |
9.9% |
11.2% |
|
All Cap Composite (Net) |
5.5% |
9.3% |
10.3% |
|
Russell 3000 Value Index |
5.6% |
11.5% |
10.2% |
|
Russell 3000 Index |
8.2% |
14.4% |
13.4% |
*Inception date is 3/31/2007 for Large Cap, Small Cap, and Focus Plus Composites. Inception date is 11/30/2007 for Focus Composite. Inception date is 4/1/2011 for All Cap Composite. Past performance is no guarantee of future results. Please see important disclosures at the end of this document.
Please reference additional performance information for each of the composites in the strategy reviews that follow and important disclosures at the end of this document.
In the discussion that follows, we generally define material contributors and detractors as companies having a greater than 1% impact on the portfolio and should be viewed in context with the performance information provided for each strategy. With respect to the discussion of contributors and detractors or the performance of any individual holding shown here, no individual investment is intended to be representative of any particular strategy. For a complete understanding, please see the performance and accompanying disclosures at the end of this letter.
We end the third quarter of 2025 feeling very good about our portfolios. Absolute performance is positive in all strategies. Relative performance has lagged. More importantly, the individual businesses we own are, in the aggregate, performing well fundamentally. Our values are compounding and many of our companies are repurchasing their shares that both we and they believe are undervalued, which is additive to our value per share growth.
Stock price volatility spiked earlier in the year primarily due to tariff related concerns. We took advantage of that volatility and allocated capital to what we believe are stable value companies at attractive price to value ratios. Since then, a number of these businesses have seen meaningful stock price appreciation while several individual companies have seen significant stock price declines in a recovering market. We have reallocated capital from our higher price to value ratio stocks into these more discounted companies. All of our portfolios have experienced positive absolute returns year to date. Despite these returns, we have improved the price to value ratios for all of our portfolios this year. We are very pleased with this result.
In a world where we see individual companies that we think are overvalued and top-down metrics imply that “the market” is, at the very least, not cheap, it is gratifying to own outstanding businesses that we believe have substantial margins of safety. Focus and Focus Plus are our “most expensive” portfolios with price to value ratios in the upper 60s, which we view as being very attractive. Our most discounted portfolio remains Small Cap, with a price to value ratio in the mid 50s. All of our portfolios are fully invested and we have a meaningful bench of discounted companies on our MVP list.
While none of these measures influence short-term performance, they do mean that we enjoy a margin of safety, which lowers risk and improves our long-term prospective returns.
Sincerely,
C.T. Fitzpatrick, CFA
Large Cap Review
As of 9/30/2025
|
INVESTMENT STRATEGY |
QTD |
YTD |
1 YEAR |
3 YEAR |
5 YEAR |
10 YEAR |
Since Inception |
|
Large Cap Composite (Gross) |
4.7% |
10.0% |
10.1% |
26.3% |
10.9% |
11.4% |
10.6% |
|
Large Cap Composite (Net) |
4.6% |
9.5% |
9.4% |
25.5% |
10.3% |
10.8% |
9.8% |
|
Russell 1000 Value Index |
5.3% |
11.7% |
9.4% |
16.9% |
13.9% |
10.7% |
7.6% |
|
S&P 500 Index |
8.1% |
14.8% |
17.6% |
24.9% |
16.5% |
15.3% |
10.9% |
Inception 03/31/2007
We purchased one new position during the quarter: Fiserv Inc. (FI)
We sold one position during the quarter: CBRE Group Inc. (CBRE)
There were two material contributors to performance: Medpace Holdings Inc. (MEDP) and Alphabet Inc. (GOOG)(GOOGL)
There was one material detractor to performance: CarMax Inc. (KMX)
Fiserv Inc. is a company we have successfully owned multiple times in the past. It is a global payments solutions and financial services provider. The business consists of two segments: merchant solutions and financial solutions. Each of these segments provides essential products and services to its customers. Fiserv’s products have high switching costs, which aids in customer retention and increases the stickiness of their revenue. The company expects to generate over $5 billion of free cash flow this year. The company is using its free cash flow to repurchase its discounted shares, which increases our value per share growth. Fiserv stock has declined meaningfully since we sold it earlier this year. Our value has remained stable. We are pleased to be able to own this wonderful business with a substantial margin of safety once again.
CBRE Group Inc. was an excellent investment for us. As the world’s largest commercial real estate services company, CBRE has a market-leading position in leasing and property sales brokerage. It also has a large and growing recurring business, which includes facilities management, project management, and investment management. These businesses provide earnings stability during cyclical downturns in commercial real estate transactions. CBRE also benefits from robust diversification across asset classes, including office, industrial & logistics, life sciences, retail, and multifamily. We purchased shares in June 2022 at peak concern regarding the future of the office due to remote work, rising interest rates, and a weakening economy. Since then, less-transactional segments have continued to see strong growth, and leasing has largely recovered. While property sales remain below pre-COVID levels, CBRE expects its core EPS to achieve a new record in 2025. CBRE’s value grew over the course of our ownership, but its share price rose faster, and we reallocated capital to more discounted businesses.
Medpace reported strong results in the second quarter. The company’s revenue grew at a mid-teens rate while operating earnings were up 20% year over year. The management team took advantage of the company’s share price weakness throughout the quarter by repurchasing nearly 6% of the outstanding shares. Importantly, Medpace significantly increased its outlook for revenue and earnings for the full year. The combination of a better biotech funding environment, fewer cancellations, and faster client decision making (among other positive trends) is now positioning the company to drive accelerated growth. This is a notable change from our prior expectation for 2025. Higher operating earnings and a meaningfully lower share count has led to a large increase in our value per share estimate. During the quarter, the share price rose faster than our value and following our discipline we trimmed the position and reallocated capital to more discounted businesses. Today, Medpace’s position size in the portfolio is consistent with its price to value ratio. We continue to be impressed with the company’s performance, and even more excited about its prospects.
Alphabet delivered strong results during its second fiscal quarter. In early September, Alphabet received a favorable remedies decision in the case brought by the Department of Justice concerning Alphabet’s default distribution agreements with original equipment manufacturers, browser developers, and wireless carriers. The remedies decision from early September and the court’s August 2024 ruling that Alphabet violated Section 2 of the Sherman Act are both still subject to appeal. However, we believe that the remedies decision issued in early September alleviates certain outsized risk to Alphabet’s business model. We continue to monitor the AI disruption risks and the ongoing antitrust cases against the company. We will follow our discipline as we receive more information.
CarMax is the largest used car retailer in the U.S. The company also has the third largest wholesale business in the U.S. and a large captive finance business. The used car industry is still feeling the effects of COVID and the resulting inflation. This was evident in CarMax’s second quarter results, during which the company’s retail volumes declined by 5%. The weak volume performance in the quarter was due to the continued abnormal volatility in used car prices as well as demand that had been pulled forward into the first quarter as consumers reacted in anticipation of the early April tariff announcements. On a year-to-date basis through the second quarter, CarMax’s volumes and profits are both up year over year. Although the used car market and CarMax’s results may remain bumpy in the short-term, we believe CarMax is a very good business with favorable long-term prospects. We believe that CarMax’s customer experience, brand, scale, vertical integration, and omnichannel approach are competitive advantages that will enable them to continue taking market share in a highly fragmented market. While the company is currently under earning, we believe it is well positioned to grow volumes, leverage fixed costs, and substantially increase earnings as the market normalizes. The company has a solid balance sheet, produces significant free cash flow, and is currently buying back shares. Our value remains stable. We followed our discipline and added to the position.
Small Cap Review
As of 9/30/2025
|
INVESTMENT STRATEGY |
QTD |
YTD |
1 YEAR |
3 YEAR |
5 YEAR |
10 YEAR |
Since Inception |
|
VVP Small Cap (Gross) |
4.3% |
6.6% |
-1.0% |
13.6% |
9.1% |
6.4% |
8.3% |
|
VVP Small Cap (Net) |
4.1% |
6.1% |
-1.7% |
12.8% |
8.3% |
5.5% |
7.3% |
|
Russell 2000 Value Index |
12.6% |
9.0% |
7.9% |
13.5% |
14.6% |
9.2% |
6.5% |
|
Russell 2000 Index |
12.4% |
10.4% |
10.8% |
15.2% |
11.6% |
9.8% |
7.7% |
Inception 03/31/2007
We did not purchase any positions during the quarter.
We did not sell any positions during the quarter.
There was one material contributor to performance: Medpace Holdings Inc.
There was one material detractor to performance: CarMax Inc.
Medpace reported strong results in the second quarter. The company’s revenue grew at a mid-teens rate while operating earnings were up 20% year over year. The management team took advantage of the company’s share price weakness throughout the quarter by repurchasing nearly 6% of the outstanding shares. Importantly, Medpace significantly increased its outlook for revenue and earnings for the full year. The combination of a better biotech funding environment, fewer cancellations, and faster client decision making (among other positive trends) is now positioning the company to drive accelerated growth. This is a notable change from our prior expectation for 2025. Higher operating earnings and a meaningfully lower share count has led to a large increase in our value per share estimate. During the quarter, the share price rose faster than our value and following our discipline we trimmed the position and reallocated capital to more discounted businesses. Today, Medpace’s position size in the portfolio is consistent with its price to value ratio. We continue to be impressed with the company’s performance, and even more excited about its prospects.
CarMax is the largest used car retailer in the U.S. The company also has the third largest wholesale business in the U.S. and a large captive finance business. The used car industry is still feeling the effects of COVID and the resulting inflation. This was evident in CarMax’s second quarter results, during which the company’s retail volumes declined by 5%. The weak volume performance in the quarter was due to the continued abnormal volatility in used car prices as well as demand that had been pulled forward into the first quarter as consumers reacted in anticipation of the early April tariff announcements. On a year-to-date basis through the second quarter, CarMax’s volumes and profits are both up year over year. Although the used car market and CarMax’s results may remain bumpy in the short-term, we believe CarMax is a very good business with favorable long-term prospects. We believe that CarMax’s customer experience, brand, scale, vertical integration, and omnichannel approach are competitive advantages that will enable them to continue taking market share in a highly fragmented market. While the company is currently under earning, we believe it is well positioned to grow volumes, leverage fixed costs, and substantially increase earnings as the market normalizes. The company has a solid balance sheet, produces significant free cash flow, and is currently buying back shares. Our value remains stable. We followed our discipline and added to the position.
Focus Review
As of 9/30/2025
|
INVESTMENT STRATEGY |
QTD |
YTD |
1 YEAR |
3 YEAR |
5 YEAR |
10 YEAR |
Since Inception |
|
VVP Focus (Gross) |
3.8% |
7.3% |
14.2% |
32.2% |
17.5% |
18.3% |
14.5% |
|
VVP Focus (Net) |
3.7% |
7.0% |
13.8% |
31.7% |
17.0% |
17.6% |
13.5% |
|
Russell 1000 Value Index |
5.3% |
11.7% |
9.4% |
16.9% |
13.9% |
10.7% |
7.9% |
|
S&P 500 Index |
8.1% |
14.8% |
17.6% |
24.9% |
16.5% |
15.3% |
10.9% |
Inception 11/30/2007
We did not purchase any positions during the quarter.
We did not sell any positions during the quarter.
There was one material contributor to performance: Alphabet Inc.
There was one material detractor to performance: Salesforce Inc. (CRM)
Alphabet delivered strong results during its second fiscal quarter. In early September, Alphabet received a favorable remedies decision in the case brought by the Department of Justice concerning Alphabet’s default distribution agreements with original equipment manufacturers, browser developers, and wireless carriers. The remedies decision from early September and the court’s August 2024 ruling that Alphabet violated Section 2 of the Sherman Act are both still subject to appeal. However, we believe that the remedies decision issued in early September alleviates certain outsized risk to Alphabet’s business model. We continue to monitor the AI disruption risks and the ongoing antitrust cases against the company. We will follow our discipline as we receive more information.
Salesforce is the world’s leading SaaS vendor for customer relationship management (CRM) and salesforce automation (SFA) software, including AI agents. Salesforce offers many other products including software for marketing automation, customer service automation, analytics, application integration, and enterprise collaboration among others. Growth guidance for the upcoming quarter was slightly lower than anticipated leading some investors to question whether Salesforce’s growth was slowing and AI investments were not bearing fruit. These questions have been amplified by a bearish industry narrative that AI will take market share from enterprise software companies like Salesforce. We believe the company is poised for sustained growth and will actually benefit from AI. Salesforce’s software is deeply embedded in the enterprise. The company is expanding its product suite with multiple cloud offerings, proprietary data, and an emphasis on being an AI innovation leader. In addition, its customers would rather focus on running their businesses instead of designing, testing, maintaining, and securing internal AI products in an ever-evolving landscape. Salesforce is deeply entrenched within its customer base, has high retention, high recurring revenue, and is a very scalable business with high margin potential. Salesforce is dominant across its offerings and is constantly innovating with new products like Agentforce to deepen customer relationships and grow the business.
Focus Plus Review
As of 9/30/2025
|
INVESTMENT STRATEGY |
QTD |
YTD |
1 YEAR |
3 YEAR |
5 YEAR |
10 YEAR |
Since Inception |
|
VVP Focus Plus (Gross) |
3.8% |
7.2% |
15.2% |
32.9% |
17.8% |
18.5% |
14.1% |
|
VVP Focus Plus (Net) |
3.7% |
6.1% |
14.0% |
31.6% |
16.7% |
17.5% |
12.9% |
|
Russell 1000 Value Index |
5.3% |
11.7% |
9.4% |
16.9% |
13.9% |
10.7% |
7.6% |
|
S&P 500 Index |
8.1% |
14.8% |
17.6% |
24.9% |
16.5% |
15.3% |
10.9% |
Inception 03/31/2007
We did not write any options contracts during the quarter. We use options to lower risk. Equity-like returns are possible when option prices reflect higher levels of implied volatility. If exercised, these options give us the right to purchase stakes in companies we want to own at a lower price than the market price at the time the option was written. We would like for these options to be exercised and have set aside cash for that purpose. We employ no leverage. In effect, we are being paid while we wait for lower prices and a corresponding larger margin of safety. We also use options to exit positions. Generally, we write covered calls with the strike price being our estimate of fair value. As with our puts, we are being paid to do something we would do anyway at a given price.
We did not purchase any positions during the quarter.
We did not sell any positions during the quarter.
There were two material contributors to performance: Alphabet Inc. and UnitedHealth Group Inc. (UNH)
There was one material detractor to performance: Salesforce Inc.
Alphabet delivered strong results during its second fiscal quarter. In early September, Alphabet received a favorable remedies decision in the case brought by the Department of Justice concerning Alphabet’s default distribution agreements with original equipment manufacturers, browser developers, and wireless carriers. The remedies decision from early September and the court’s August 2024 ruling that Alphabet violated Section 2 of the Sherman Act are both still subject to appeal. However, we believe that the remedies decision issued in early September alleviates certain outsized risk to Alphabet’s business model. We continue to monitor the AI disruption risks and the ongoing antitrust cases against the company. We will follow our discipline as we receive more information.
As a reminder, we purchased UnitedHealth Group in the second quarter after its stock had declined from approximately $600 per share to under $300 per share. Our estimated value remained stable. In late July, UnitedHealth Group issued its revised 2025 financial guidance which was poorly received by the market. During the second week of September, UnitedHealth Group made several announcements that were positively received by investors. The company reaffirmed its 2025 guidance. It also disclosed that based on preliminary review, 78% of its Medicare Advantage membership will be in 4 star or higher plans for Star Year 2026/Payment Year 2027, which is consistent with historical performance.
Salesforce is the world’s leading SaaS vendor for customer relationship management (CRM) and salesforce automation (SFA) software, including AI agents. Salesforce offers many other products including software for marketing automation, customer service automation, analytics, application integration, and enterprise collaboration among others. Growth guidance for the upcoming quarter was slightly lower than anticipated leading some investors to question whether Salesforce’s growth was slowing and AI investments were not bearing fruit. These questions have been amplified by a bearish industry narrative that AI will take market share from enterprise software companies like Salesforce. We believe the company is poised for sustained growth and will actually benefit from AI. Salesforce’s software is deeply embedded in the enterprise. The company is expanding its product suite with multiple cloud offerings, proprietary data, and an emphasis on being an AI innovation leader. In addition, its customers would rather focus on running their businesses instead of designing, testing, maintaining, and securing internal AI products in an ever-evolving landscape. Salesforce is deeply entrenched within its customer base, has high retention, high recurring revenue, and is a very scalable business with high margin potential. Salesforce is dominant across its offerings and is constantly innovating with new products like Agentforce to deepen customer relationships and grow the business.
All Cap Review
As of 9/30/2025
|
INVESTMENT STRATEGY |
QTD |
YTD |
1 YEAR |
3 YEAR |
5 YEAR |
10 YEAR |
Since Inception |
|
VVP All Cap (Gross) |
5.7% |
9.9% |
7.4% |
23.8% |
10.1% |
10.4% |
11.2% |
|
VVP All Cap (Net) |
5.5% |
9.3% |
6.6% |
22.9% |
9.3% |
9.5% |
10.3% |
|
Russell 3000 Value Index |
5.6% |
11.5% |
9.3% |
16.7% |
13.9% |
10.6% |
10.2% |
|
Russell 3000 Index |
8.2% |
14.4% |
17.4% |
24.1% |
15.7% |
14.7% |
13.4% |
Inception 04/01/2011
We purchased one new position during the quarter: Fiserv, Inc.
We sold two positions during the quarter: Sealed Air Corp (SEE) and Jones Lang LaSalle Inc. (JLL)
There were two material contributors to performance: Medpace Holdings Inc. and Alphabet Inc.
There were no material detractors to performance.
Fiserv Inc. is a company we have successfully owned multiple times in the past. It is a global payments solutions and financial services provider. The business consists of two segments: merchant solutions and financial solutions. Each of these segments provides essential products and services to its customers. Fiserv’s products have high switching costs, which aids in customer retention and increases the stickiness of their revenues. The company expects to generate over $5 billion of free cash flow this year. The company is using its free cash flow to repurchase its discounted shares, which increases our value per share growth, Fiserv stock has declined meaningfully since we sold it earlier this year. Our value has remained stable. We are pleased to be able to own this wonderful business with a substantial margin of safety once again.
We sold Sealed Air Corp and Jones Lang LaSalle in order to allocate capital to more discounted companies. Both remain on our MVP list and we still own Sealed Air Corp in our small cap portfolio and Jones Lang LaSalle in our small and large cap strategies.
Medpace reported strong results in the second quarter. The company’s revenue grew at a mid-teens rate while operating earnings were up 20% year over year. The management team took advantage of the company’s share price weakness throughout the quarter by repurchasing nearly 6% of the outstanding shares. Importantly, Medpace significantly increased its outlook for revenue and earnings for the full year. The combination of a better biotech funding environment, fewer cancellations, and faster client decision making (among other positive trends) is now positioning the company to drive accelerated growth. This is a notable change from our prior expectation for 2025. Higher operating earnings and a meaningfully lower share count has led to a large increase in our value per share estimate. During the quarter, the share price rose faster than our value and following our discipline we trimmed the position and reallocated capital to more discounted businesses. Today, Medpace’s position size in the portfolio is consistent with its price to value ratio. We continue to be impressed with the company’s performance, and even more excited about its prospects.
Alphabet delivered strong results during its second fiscal quarter. In early September, Alphabet received a favorable remedies decision in the case brought by the Department of Justice concerning Alphabet’s default distribution agreements with original equipment manufacturers, browser developers, and wireless carriers. The remedies decision from early September and the court’s August 2024 ruling that Alphabet violated Section 2 of the Sherman Act are both still subject to appeal. However, we believe that the remedies decision issued in early September alleviates certain outsized risk to Alphabet’s business model. We continue to monitor the AI disruption risks and the ongoing antitrust cases against the company. We will follow our discipline as we receive more information.
Closing
We are very proud of the work our research team has done this year. We have done an excellent job of maintaining our MVP list and reacting quickly to opportunities created by stock price volatility. We are also grateful for you, our client partners. Your long-term time horizon allows us to execute our investment philosophy. The combination is very powerful and gives us a competitive advantage in the marketplace.
We hope that you enjoy the changing seasons and look forward to updating you in the New Year.
The Vulcan Value Partners Investment Team,
C.T. Fitzpatrick, CFA
Stephen W. Simmons, CFA
Colin Casey
Taylor Cline, CFA
David Shelton
Important Definitions
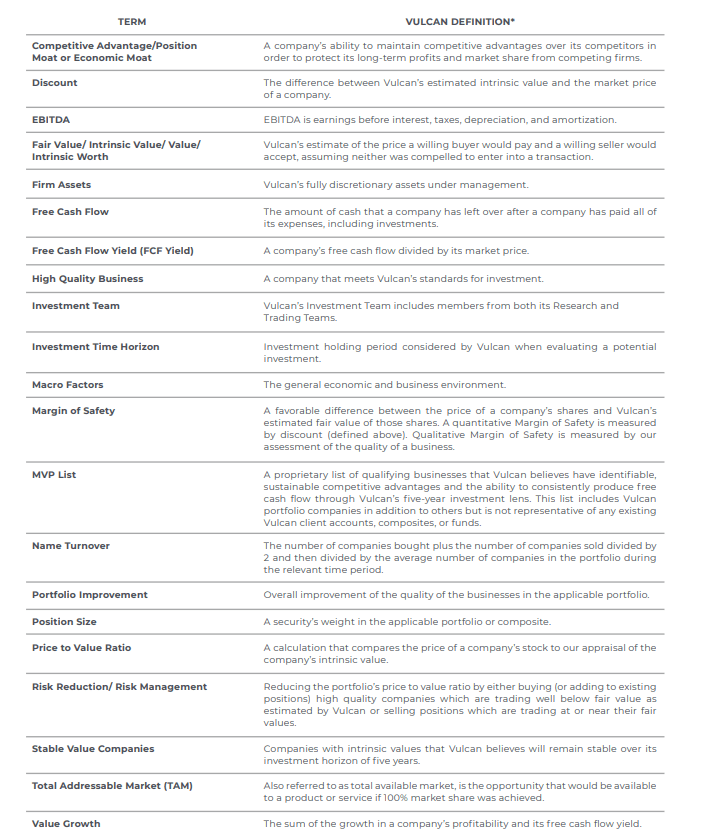
*These definitions should be referenced in the context of Vulcan commentary and do not necessarily represent the meanings that are used in all contexts.
|
Disclosures Vulcan Value Partners LLC is an investment advisor registered with the Securities and Exchange Commission under the Investment Advisers Act of 1940. Registration does not imply a certain level of skill or training. The performance presented is for our Large Cap Composite, Focus Composite, Focus Plus Composite, Small Cap Composite, and All Cap Composite. The model composite portfolio performance figures reflect the deduction of brokerage or other commissions and the reinvestment of dividends and capital gains. We have presented returns gross and net of fees. Gross of fees returns are calculated gross of management and custodial fees and net of transaction costs. Net of fees returns are calculated net of management fees and transaction costs and gross of custodian fees, taken at the highest applicable fee. The performance figures do not reflect the deduction of any taxes an investor might pay on distributions or redemptions. Our standard fees are presented in Part 2 of our ADV. Opinions and views expressed constitute the judgment of Vulcan Value Partners as of the date shown and may involve a number of assumptions and estimates which are not guaranteed and subject to change without notice. No representation is being made with respect to their accuracy on any future date. Although the information and any opinions or views given have been obtained from or based on sources believed to be reliable, no warranty or representation is made as to their correctness, completeness or accuracy. Opinions, estimates, forecasts, and statements of financial market trends that are based on current market conditions constitute our judgment and are subject to change without notice, including any forward-looking estimates or statements which are based on certain expectations and assumptions. The views and strategies described may not be suitable for all clients. This document does not identify all the risks (direct or indirect) or other considerations which might be material when entering any financial transaction. Vulcan focuses on long-term capital appreciation; purchasing publicly-traded companies that we believe are competitively entrenched and emphasize a margin of safety in terms of price as compared to our estimation of their intrinsic value. Value is our estimate of the intrinsic worth of a company based on our assessment of certain quantitative and qualitative factors. Vulcan defines risk reduction as reducing the portfolio’s price to value ratio by either buying (or adding to existing positions) high quality companies which are trading well below fair value as estimated by Vulcan or selling positions which are trading at or near their fair values. References to specific securities, asset classes and financial markets are for illustrative purposes only and are not intended to be, and should not be interpreted as, recommendations. There is no assurance that any securities discussed herein will remain in the composite or that the securities sold will not be repurchased. The specific securities identified and described are not representative of all the securities purchased, sold, or recommended for client accounts. Actual holdings may vary for each client and there is no guarantee that a particular client’s account will hold all of the securities described. The securities discussed do not represent the composite’s entire portfolio. It should not be assumed that any of the securities transactions or holdings discussed will prove to be profitable, or that the investment recommendations or decisions we make in the future will be profitable or will equal the investment performance of the securities discussed herein. There may be market or economic conditions which affect our performance, or that of our relevant benchmarks, that may have changed Vulcan Value Partners’ views regarding the prospects of any particular investment. It should not be assumed that recommendations made in the future will be profitable or will equal the performance of the securities discussed in this letter. Vulcan buys concentrated positions for our portfolios, at times averaging 5% in our model portfolios, which may make our performance more volatile than that of our benchmark indices, and our performance may diverge from an index, positively or negatively, as a result. Our focus is on long-term capital appreciation, so our clients should consider at least a five year time horizon for an investment with Vulcan. The S&P 500 Index is an unmanaged index of 500 common stocks chosen for market size, liquidity, and industry group representation. It is a market-value weighted index. The Russell 1000® Value Index measures the performance of the large cap value segment of the U.S. equity universe. It includes those Russell 1000 companies with lower price-to-book ratios and lower expected growth values. The Russell 2000® Index includes the 2000 firms from the Russell 3000® Index with the smallest market capitalizations. The Russell 2000® Value Index measures the performance of those Russell 2000 companies with lower price-to-book ratios and lower forecasted growth values. Index figures do not reflect deductions for any fees, expenses, or taxes. Investors cannot invest directly in an index. Vulcan Value Partners claims compliance with the Global Investment Performance Standards (GIPS®). To receive a complete list and description of Vulcan Value Partners’ composites and a presentation that adheres to the GIPS standards, please contact Compliance at 205.803.1582 or write Vulcan Value Partners, Three Protective Center, 2801 Highway 280 South, Suite 300, Birmingham, AL 35223. Large Cap Composite Information: This portfolio strategy invests in companies with larger market capitalizations. Subject to price, any publicly traded company with above average economics that is too large to be included in our small capitalization composite would be a potential investment in this portfolio. A core position is 5% so that theoretically our clients would hold 20 names diversified across various industries. It is very rare that enough companies are sufficiently discounted to warrant this level of concentration so concentration will vary with the price to value ratio. We will invest client assets in positions as small as 1% when price to value ratios are higher. We will not invest client assets in any business that is trading above our estimate of fair value. The composite benchmark is the S&P 500 which is an index of 500 stocks selected based on market size, liquidity, and sector and is designed to provide a broad snapshot of the overall U.S. equity market. New accounts that fit the composite definition are added at the beginning of the first full calendar month for which the account is under management. Closed account data is included in the composite as mandated by the standards in order to eliminate a survivorship bias. The composite was created on March 31, 2007. Portfolios below the minimum asset level of $50,000 are not included in the composite. Focus Composite Information: This portfolio strategy invests in companies with larger market capitalizations. Subject to price, any publicly traded company with above average economics that is too large to be included in our small capitalization composite would be a potential investment in this portfolio. This is a very concentrated portfolio holding between seven and fourteen positions. We will not invest client assets in any business that is trading above our estimate of fair value. The composite benchmark is the S&P 500 which is an index of 500 stocks selected based on market size, liquidity, and sector and is designed to provide a broad snapshot of the overall U.S. equity market. New accounts that fit the composite definition are added at the beginning of the first full calendar month for which the account is under management. Closed account data is included in the composite as mandated by the standards in order to eliminate a survivorship bias. The composite was created on November 30, 2007. Portfolios below the minimum asset level of $50,000 are not included in the composite. Focus Plus Composite Information: This portfolio strategy invests in companies with larger market capitalizations. Subject to price, any publicly traded company with above average economics that is too large to be included in our small capitalization composite would be a potential investment in this portfolio. This is a very concentrated portfolio holding between seven and fourteen positions. We will use options instead of limit orders to acquire and/or sell the stock. We do not intend to employ any leverage, but will utilize options to sell volatility when it is expensive and buy volatility when it is cheap. We will focus on options which give our clients the right to buy or sell stock in companies at prices that we would buy or sell anyway, and we will generate revenue through option premiums. Generally, we plan to use options instead of buying stock directly when we can earn double digit returns from selling options. We only intend to purchase options under rare circumstances, and to continue to focus on reducing risk through the purchase of qualifying companies at attractive prices. We will not invest client assets in any business that is trading above our estimate of fair value. The composite benchmark is the S&P 500 which is an index of 500 stocks selected based on market size, liquidity, and sector and is designed to provide a broad snapshot of the overall U.S. equity market. New accounts that fit the composite definition are added at the beginning of the first full calendar month for which the account is under management. Closed account data is included in the composite as mandated by the standards in order to eliminate a survivorship bias. The composite was created on March 31, 2007. Portfolios below the minimum asset level of $50,000 are not included in the composite. Small Cap Composite Information: This portfolio strategy invests in companies with smaller market capitalizations. Subject to price, any publicly traded company with above average economics that is not “large” would be a potential investment in this portfolio. While we do not have any defined cutoffs, we use the Russell 2000 as a guide to define small cap, and any small publicly traded company with reasonable economics would be a potential investment in this portfolio. A core position is 5% so that theoretically our clients would hold 20 names diversified across various industries. It is very rare that enough companies are sufficiently discounted to warrant this level of concentration so concentration will vary with the price to value ratio. We will invest client assets in positions as small as 1% when price to value ratios are higher. We will not invest client assets in any business that is trading above our estimate of fair value. The composite benchmark is the Russell 2000 Index which measures the performance of the small-cap segment of the U.S. Equity universe and includes approximately 2,000 of the smallest securities based on a combination of their market cap and current index membership. New accounts that f it the composite definition are added at the beginning of the first full calendar month for which the account is under management. Closed account data is included in the composite as mandated by the standards in order to eliminate a survivorship bias. The composite was created on March 31, 2007. Portfolios below the minimum asset level of $50,000 are not included in the composite. All Cap Composite Information: This portfolio strategy invests in companies across all market capitalizations. Generally, positions held in this strategy will also be held in either the Large Cap or Small Cap strategies, though sometimes with differing weights. As with those strategies, a core position in this portfolio is 5% so that theoretically we would hold 20 positions diversified across various industries. Because it is rare that we would find 20 companies meeting our investment guidelines, concentration will vary with the price to value ratios we determine for companies in which we invest. We will invest client assets in positions as small as 1% when price to value ratios are higher. We will not invest client assets in any business that is trading above our estimate of fair value. The composite benchmark is the Russell 3000 Index which measures the performance of the largest 3000 US companies representing approximately 98% of the investable US Equity market. New accounts that fit the composite definition are added at the beginning of the first full calendar month for which the account is under management. Closed account data is included in the composite as mandated by the standards in order to eliminate a survivorship bias. The composite was created on April 1, 2011. Portfolios below the minimum asset level of $50,000 are not included in the composite. All returns are expressed in US dollars. |
Editor’s Note: The summary bullets for this article were chosen by Seeking Alpha editors.