If there is someone on CNBC, that I like, it is Josh Brown from Ritholz Wealth Management.
He does his homework. He is not opposed to using technicals (in fact he often relies on it). He accepts defeat. He lets his wins run. He is not perfect of course, but he makes a lot of sense, and I have used him in some of my personal stock picks that have done well including Corning more recently.
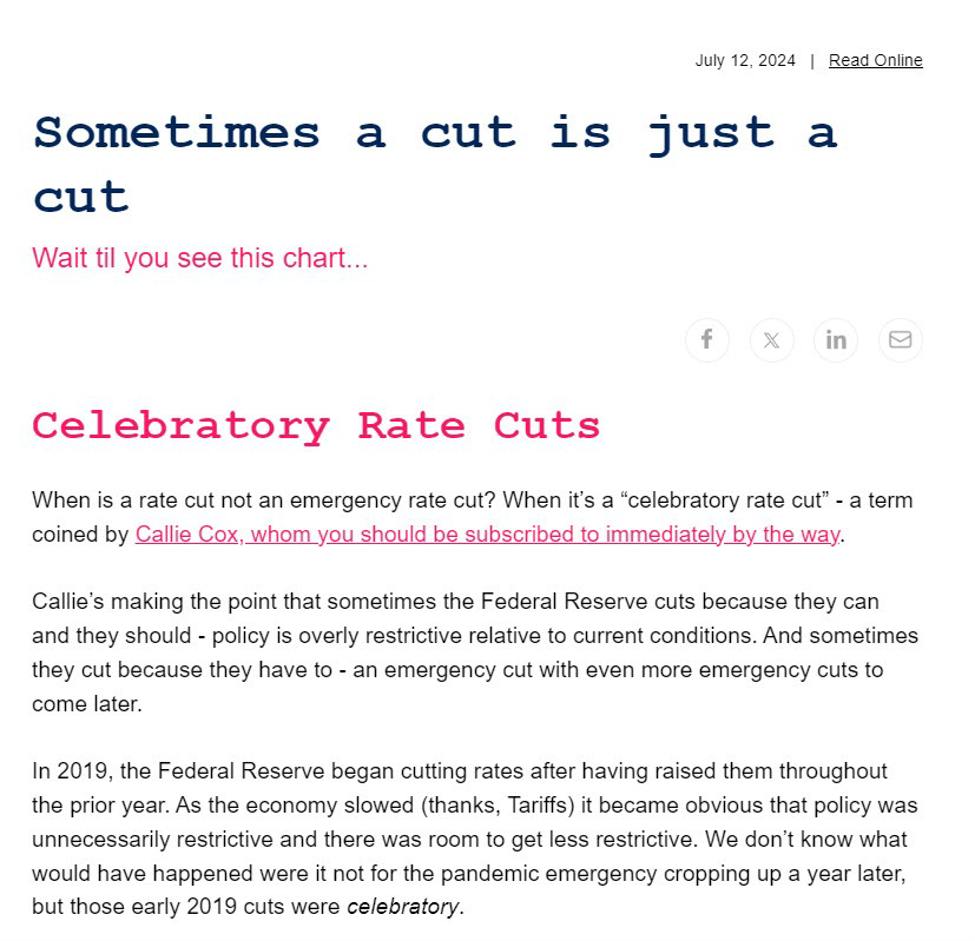
I get his emails, and in his latest email, he talked of the “Celebratory Rate Cut” ahead.
He feels that after the CPI data this week and the Fed Chair testimony, that the Fed is now ready to either cut in July or September and with that comes a lot of chatter about what next?. Is it a prelude to a recession? Is a prelude to lower stock prices.
In the email, he focused on a chart from Callie Cox and “Chart Kid Matt” who looked at the last 17 first rate cuts, and looked out 365 days to see
- Was there a recession 1 year hence?
- What did the stock market do?
This is what the results looked like:
It looks overwhelming but it is really quite easy. Each cut rebased the S&P at 100. The chart then looked at the price action over the next year, and scaled to a gain or loss from the 100 base.
If you look at the top lines in the chart (which are all red indicative of years when there was a recession), they ended the year with the index at 140. That represents gains of nearly 40%.
If you look at the downside, the worst year was a decline to around 65 (also a red line). So the index lost 35 points from 100 or -35%.
As far as recessions or not, the chart outlines the years where there was no recession after the first cut (they are represented by the blue lines). The times when there were a recession are represented by the redlines. The years are in red.
In summary:
- Of the 17 cuts, 7 did not lead to a recession and 10 did. It is hard for the Fed to steer the ship to a soft landing but it happens (as least a year later)
As far as the stock market performance:
- 4 years the S&P was lower.
- 1 year was nearly unchanged
- 12 years were higher.
As outlined:
- 4 years had gains near 40% a year later
- 1 year had a loss of around 35%. Another year had a loss of around 22%.
So what does it all mean?
Josh sums it up the best…
As you can see, interest rate cuts have not historically meant a “slam dunk” recession call. Sometimes a cut is just a cut.
Also, it does not always mean sell stocks as well.
He adds:
… range of outcomes after the initial cut are all over the place. Crafting a narrative for what will happen to either the stock market or the economy (or both) as a result of the initial interest rate cut is an exercise in telling fairy tales. You cannot know because it’s unknowable. Durable portfolios are the right answer, not predictions, not extrapolations, not cherry-picking to satisfy a predetermined opinion.
I bring this to your attention because based on the June CPI report we got this week, it’s apparent that the first rate cut of the cycle is now at hand – likely in July or September. You will read and hear innumerable amounts of opinions about what this means and where things are surely headed. I want you to be armed with this information so that you don’t fall prey to the financial media industrial complex and start making a lot of bad decisions with your long-term investments.
Don’t fall for all the chatter about “this” or “that” will happen once the Fed pulls the trigger. No one really knows. HOwever, most of the time (10 or 17) there is a recession, but most of the time stocks still go higher (12 of 17).
Now you know.