
Nattakorn Maneerat
Don’t Let Scaremongers Freak You Out About The Economy
Charlie Bilello 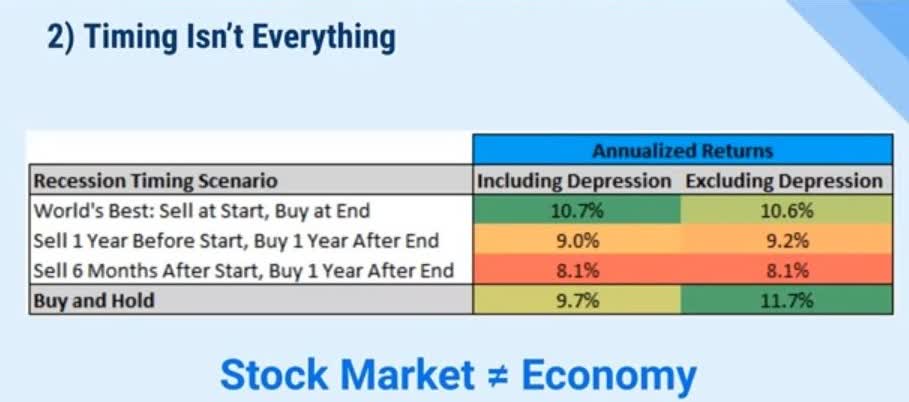
The stock market is not the economy, and historically, perfectly timing the economy would not have beaten buy-and-hold.
The goal of these economic updates is never to predict what the stock market will do next. It’s to provide a big-picture view of the economy close to God’s eye, which ultimately drives corporate earnings fundamentals.
Remember that stock prices will always drive the narrative. If stocks are going up, CNBC and Bloomberg (and YouTube) pundits will make up plausible-sounding reasons to explain why.
When stocks are falling fast?
You’ll hear plausible-sounding reasons for why stocks are falling, and plenty of doomsday prophets will be crowing about how they were right, and this is just the beginning of a much larger crash.
The CNBC Market’s In Turmoil Indicator: 106/106 Accuracy
Charlie Bilello 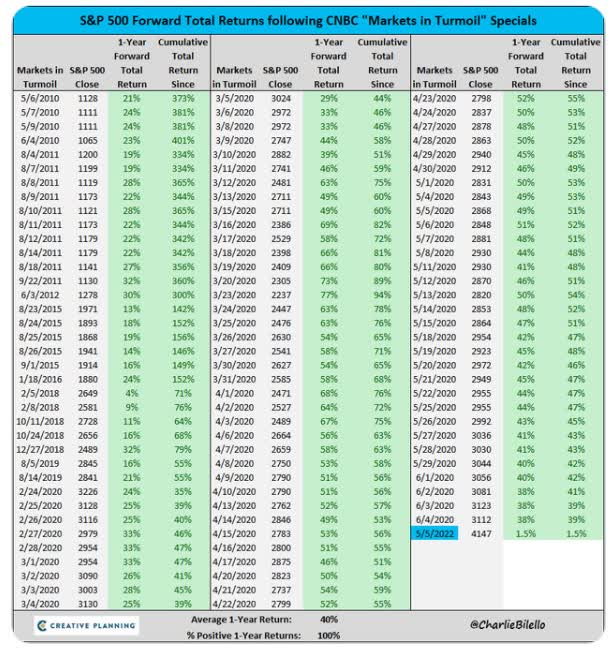
Since the Great Recession ended, CNBC has had “markets in turmoil” specials 106 times, and the average 1-year return following these specials is a 40% gain.
Why?
Charlie Bilello 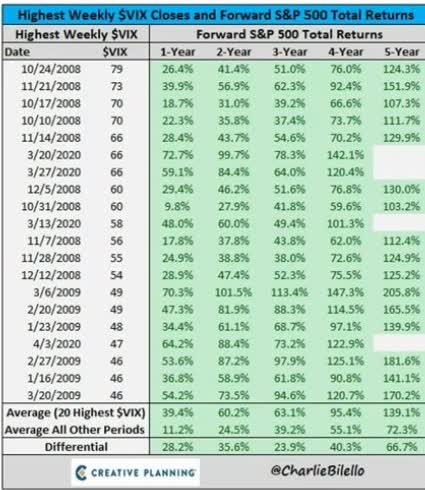
Because when volatility is at its peak, stock prices tend to be most irrationally underpriced.
But to enjoy those 40% one-year returns following peak market terror, you must remain calm and rational and remember what Josh Brown said on August 6th.
When the VIX is over 60, don’t overthink it. Just shut up and buy something!” – Josh Brown, CEO Ritholtz Wealth Management.
You can always cherry-pick some bit of bad news, either for a company or the entire economy.
The Economy Is DOOMED!
Daily Chartbook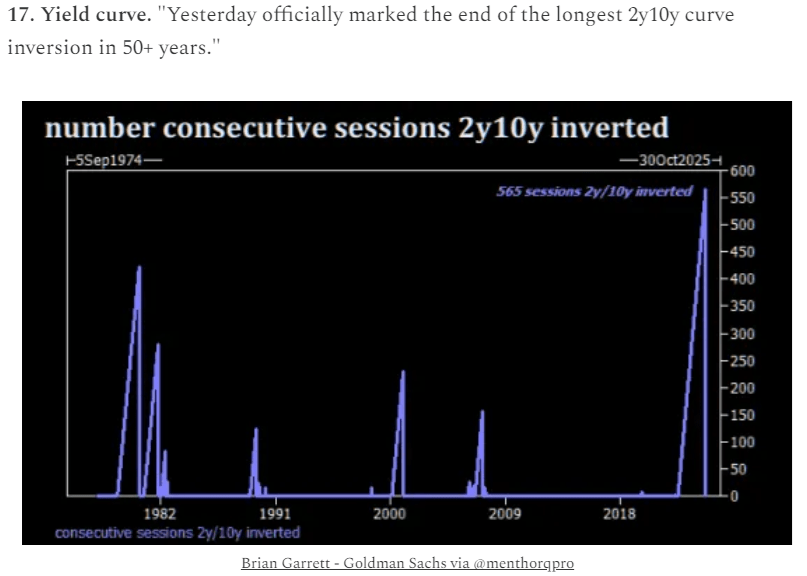
Unless There Isn’t A Recession!
Daily Chartbook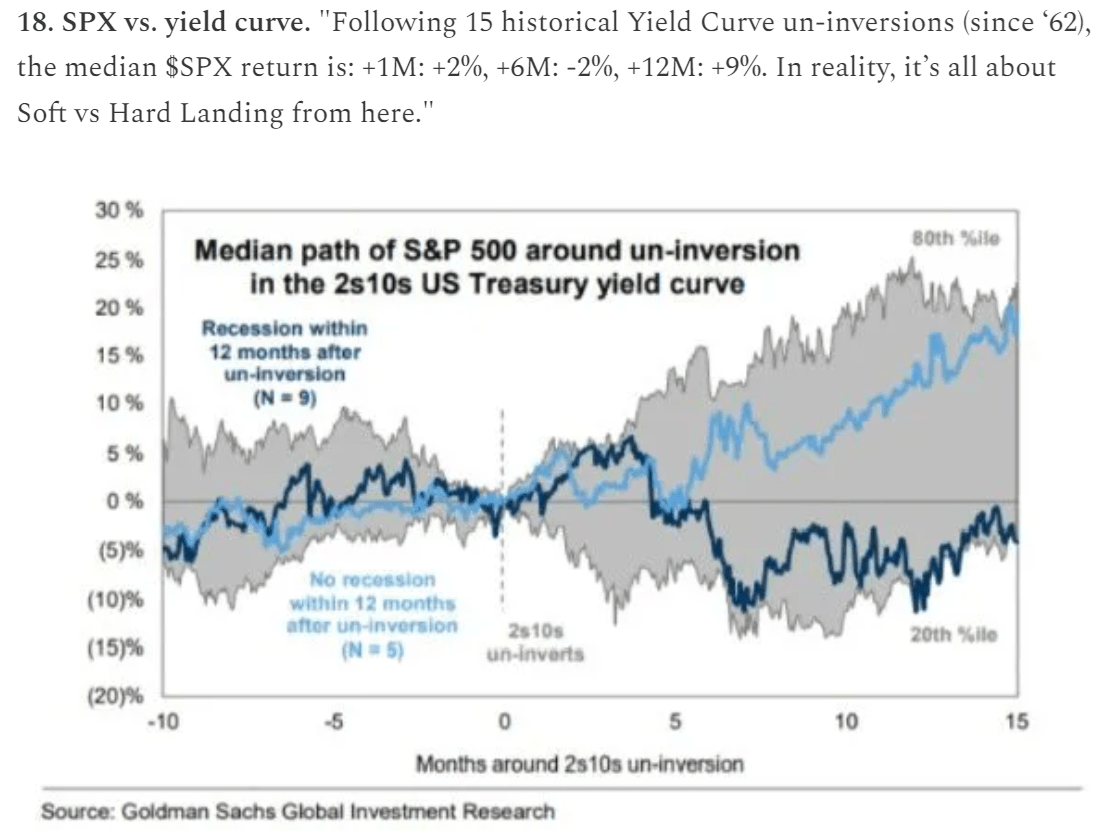
All Else Equal Lower Rates Are Slightly Better For Stocks
Daily Chartbook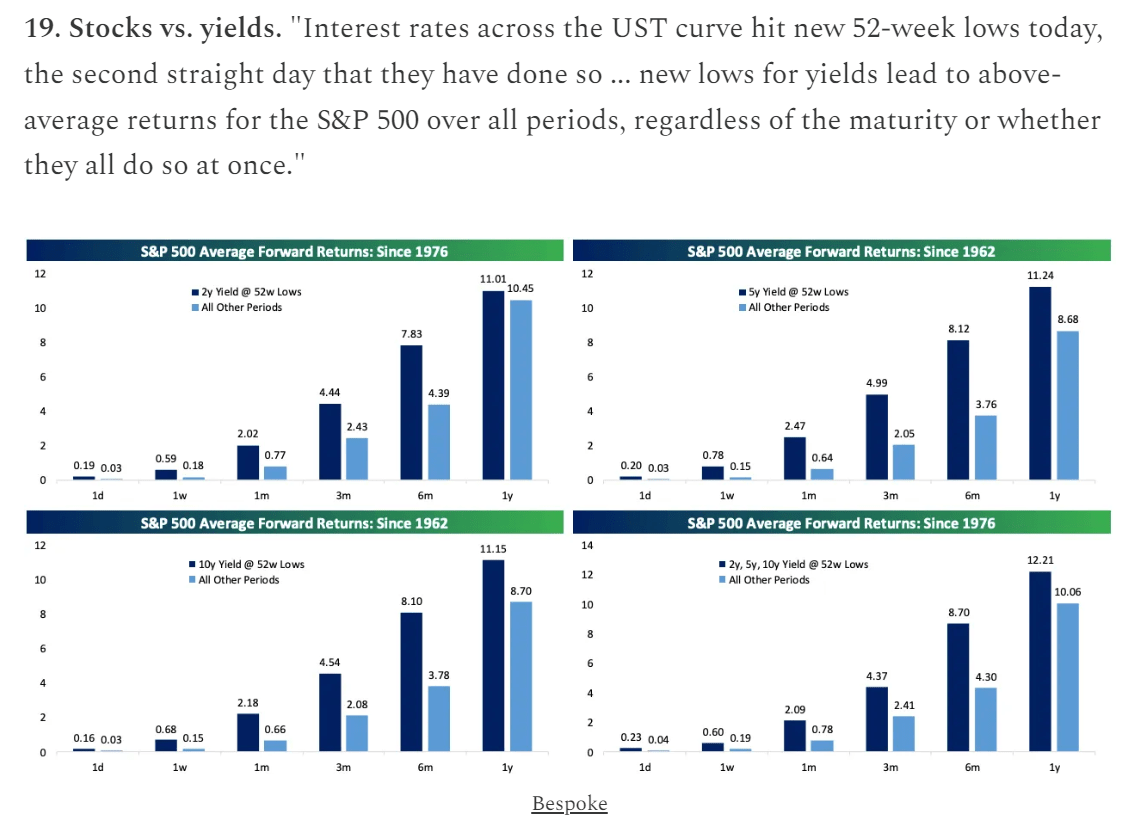
1% to 3% differences in annual stock returns are not significant.
What matters to the health of the economy is the big picture.
The plural of anecdote is anecdotes, not data.” -Brian Dunning.
YCharts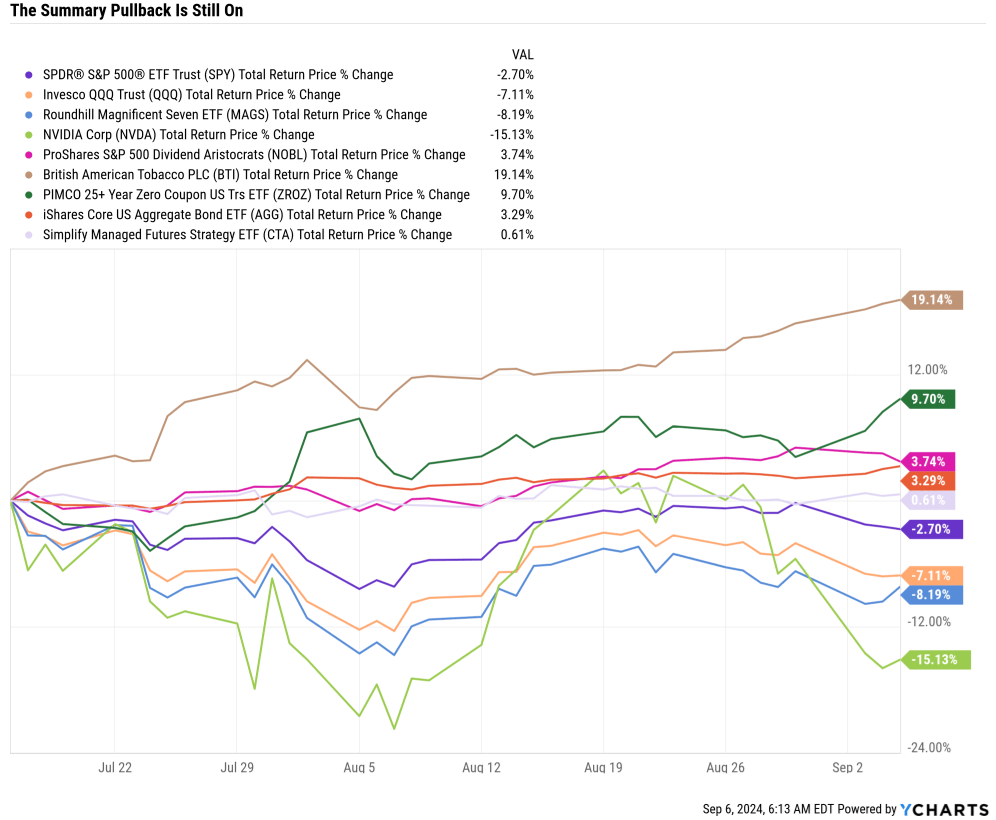
The pullback that began on July 16th is still ongoing. The S&P came within 0.2% of record highs before three straight days of declines.
One was a 2.12% decline, the worst since August 5th, when the S&P hit a 4.3% intraday low.
The S&P is now 2.7% below record highs; the Nasdaq is down 7%, the Mag 7 is down 8%, and NVIDIA (NVDA), leader of the seven this year, is down 15%.
Note that plenty of assets is up during this downturn:
- Managed Futures up as much as 0.6%
- Bonds up 3%
- The dividend aristocrats are up 4%
- Long bonds are up as much as 10%
- High-yield aristocrats like British American (BTI), up as much as 19%.
In other words, this is not like 2022, when almost nothing was working (apart from energy and managed futures).
The Most Important Jobs Report Since The Last One
FactSet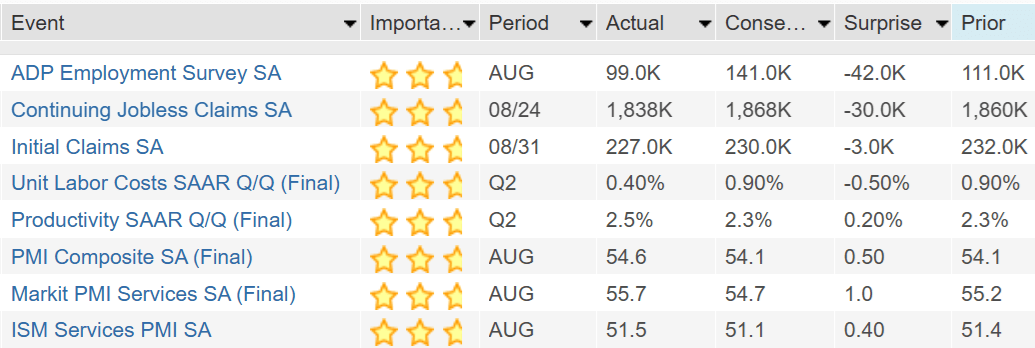
The ADP National Employment Report is a measure of employment based on an anonymous subset of ADP payroll data covering approximately 225,000 establishments and 14 million employees working in all 19 of the major North American Industrial Classification (NAICS) private industrial sectors.” – FactSet.
ADP provides a monthly private jobs report, though it is historically not predictive of what the jobs report from the Bureau of Labor Statistics says on the first or 2nd Friday of each month.
This month, private jobs missed badly, coming in at 99K compared to the consensus of 141 K, and were slightly weaker than last month’s 111 K.
The job market’s downward drift brought us to slower-than-normal hiring after two years of outsized growth,” said Nela Richardson, chief economist at ADP. “The next indicator to watch is wage growth, which stabilizes after a dramatic post-pandemic slowdown.” – ADP.
Mining, construction, transportation, and leisure are the first places jobs are lost in a recession. ADP reports 60K net job growth in these cyclical industries, which accounts for the majority (61%) of the job growth.
Daily Shot 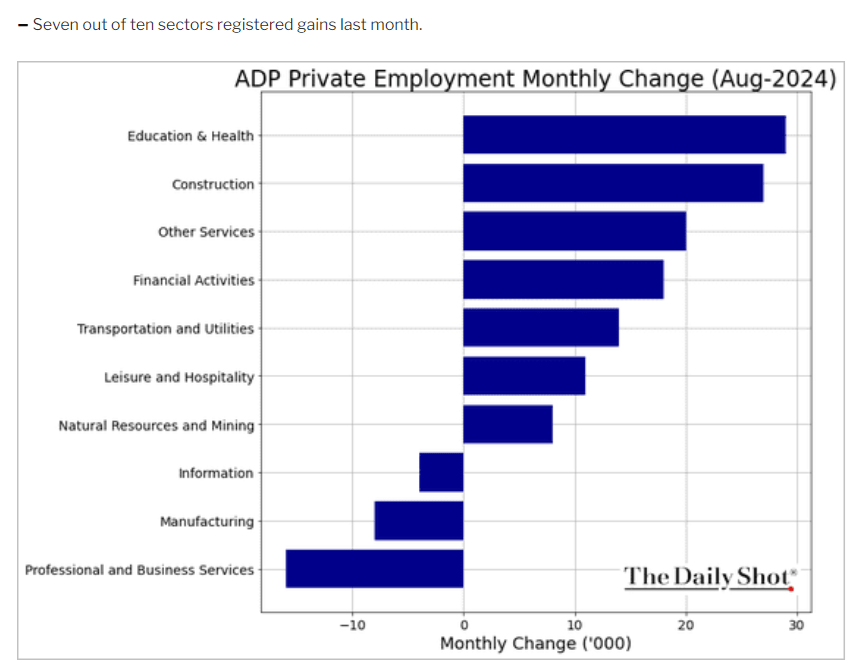
- ADP report points to a cooling but growing economy.
Daily Shot 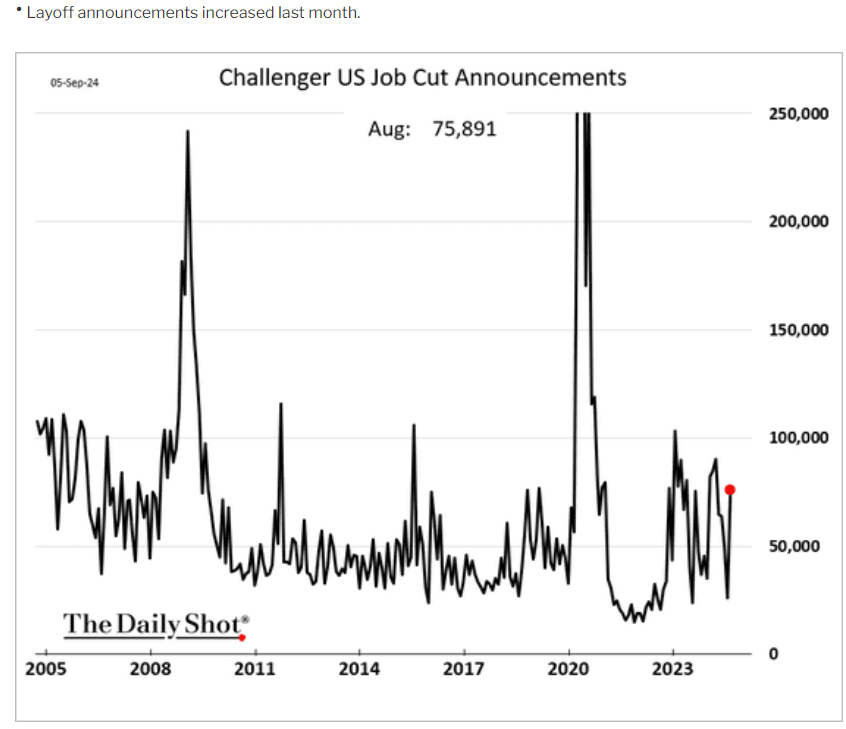
Announced job cuts have spiked in the last month, though they remain near the 50K monthly average since 2015.
They are now consistent with growth slowdowns such as 2016, 2011, and 2006.
Daily Chartbook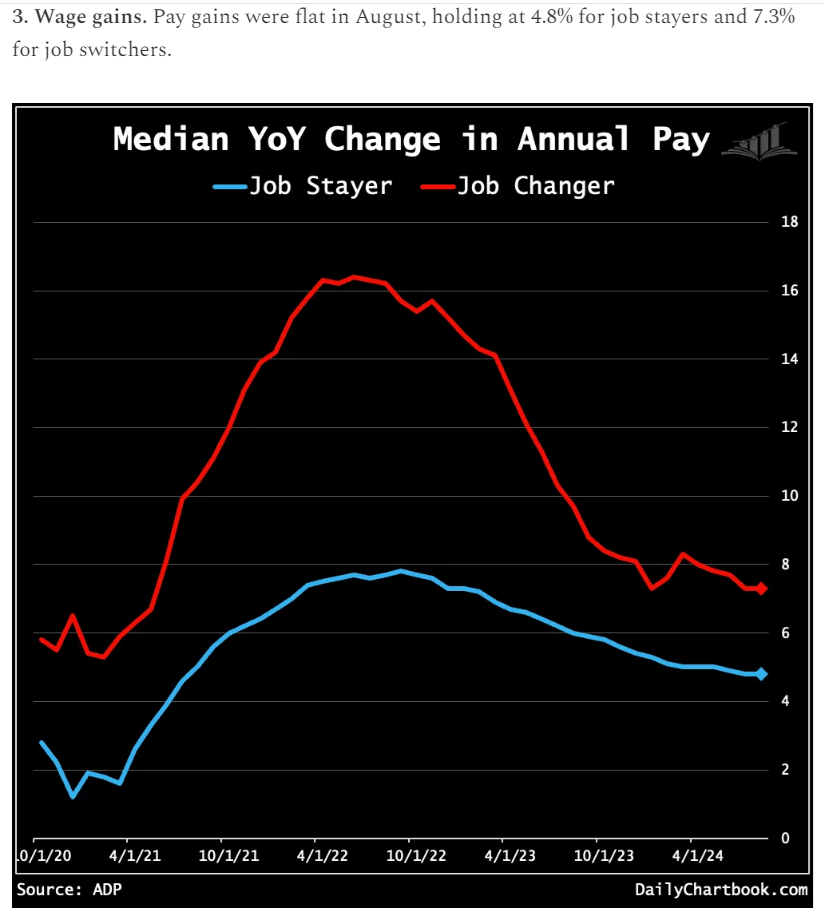
Wages are stable and firmly above inflation.
- 4.8% wage growth — 2.9% CPI = 1.9% real wage growth for job stayers.
The weekly jobless claims continue to drift lower, down to 227,000.
July 2024 JOLTS Report: Unwelcome News
The Job Openings and Labor Turnover Survey (JOLTS) report shows the number of job openings and the number of people quitting and being fired each month.
The Indeed Hiring Lab is the economic research arm of Indeed, the world’s largest job search website. Its global team of economists and researchers is dedicated to providing insights on international labor market trends and conditions.
Key Points:
Job openings fell in July to 7.7 million, with the ratio of job openings to unemployed workers falling below its 2019 average.
Hiring and quitting ticked up in July, but those increases are likely bounce-backs from low readings in June. Both series are still trending downward.
Fortunately, layoffs remain low. However, unemployment is likely to keep drifting higher if hiring remains depressed.” – Indeed Hiring Lab.
We’re approaching one job opening per person seeking employment after hitting a record 2:1 ratio during the pandemic. We just dipped under pre-pandemic levels.
The Bureau of Labor Statistics estimates 0.4% annual workforce growth this coming decade and requires 55K monthly net job gains to keep up with the population.
Daily Chartbook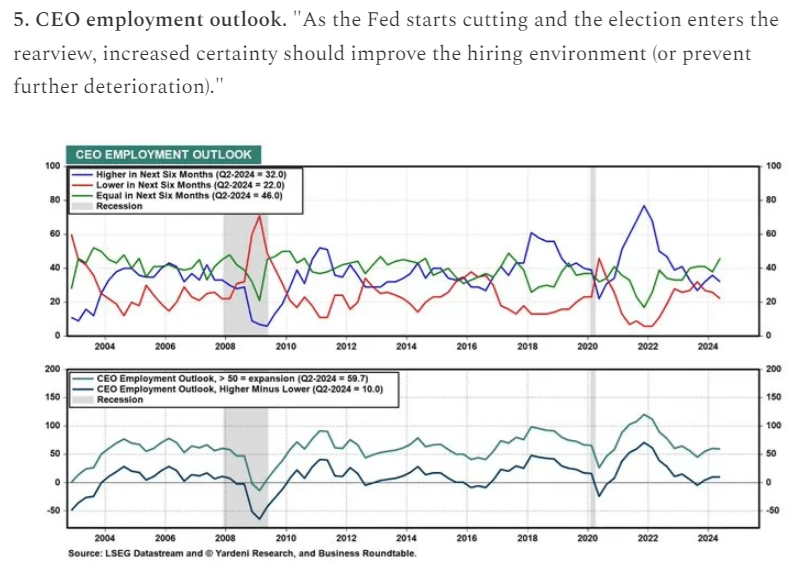
CEOs have become more optimistic about hiring recently, likely due to expectations that the Fed will cut steadily and that we’ll avoid recession.
However, Bloomberg has more conservative estimates in terms of this economic cycle.
- Bloomberg: Sub 100K jobs = Fed will cut rates 50 basis points.
- Citigroup: 125K or fewer jobs = Fed will likely cut rates 50 basis points.
Bloomberg 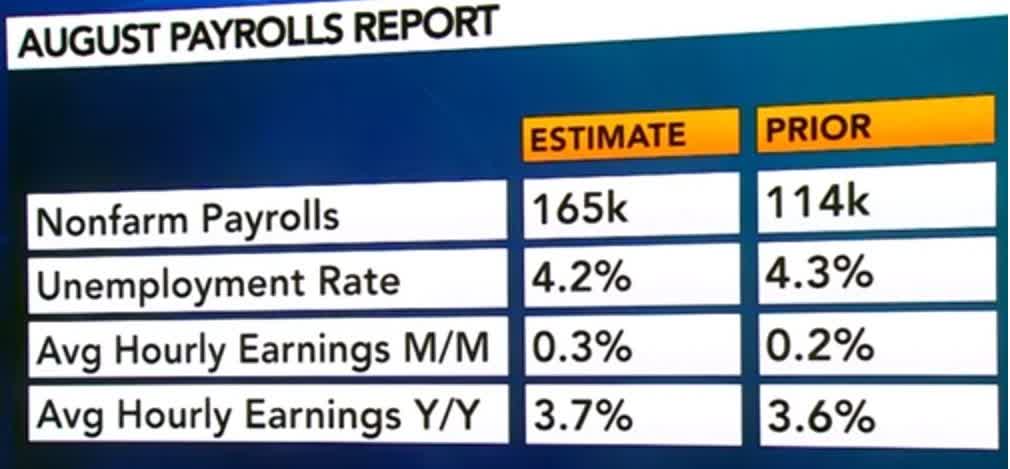
The consensus for the Friday jobs report was for a recovery to 165K net jobs, compared to last month’s surprisingly low 114K.
Unemployment was expected to fall to 4.2%, and wage growth grew to 3.7%.
Thanks to 2.5% productivity (revised up from 2.3%), that bodes very well for inflation.
- Fundamental Inflation: Wages — productivity:
- 3.7% wages — 2.5% productivity = 1.2% fundamental inflation.
Daily Shot 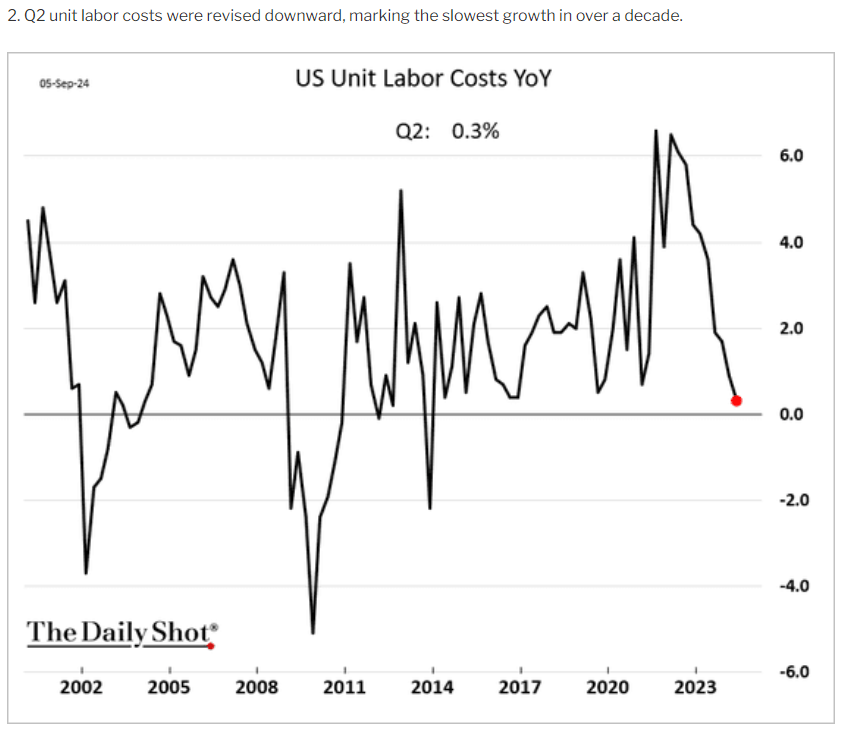
Strong productivity drives down unit labor costs, which is excellent for inflation and corporate profits.
So, what did the jobs report come in at?
Bloomberg 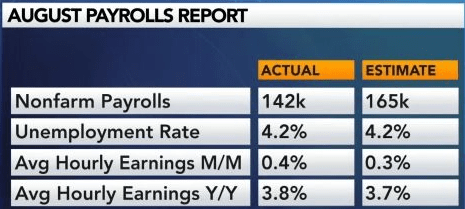
Aug US Nonfarm Payrolls +142K vs. StreetAccount consensus +160K; Aug Unemployment Rate 4.2% vs. SA consensus 4.2%
Jul Nonfarm Payrolls revised to +89K from +114K
Jun Nonfarm Payrolls revised to +118K from +179K
Jul Unemployment Rate unrevised at 4.3%
Aug Labor force participation rate 62.7% vs. 62.7% in July.
The 3-month rolling average falls from 170K to 116K.
Sixty-one thousand downward revisions over the last two months.
- Average of -30.5K per month.
- 111.5K forward revised job growth
- 106K rolling three months forward revised job growth.
In other words, based on the recent negative revisions, I expect this month’s numbers to fall to 112K next month, dropping the 3-month rolling average to 106K.
New hiring has slowed dramatically, though unemployment remains near 50-year lows, and there is no sign of rising job cuts. Wage growth of 3.8% is up from 3.6% at recent lows, which is much higher than expected inflation next week.
- 3.8% wage growth -2.6% CPI = 1.2% real wage growth.
- 3.8% wage growth -1.3% real-time inflation = 2.4% real wage growth.
Non-supervisors are 80% of workers.
- 4.1% YOY wage growth for “regular” workers.
- 3.8% weekly earnings growth for “regular workers.”
In the past year, a modest decline in hours worked brought weekly income in line with overall wage growth.
Recently, hours worked have started to rebound.
- If non-supervisory wages grow by 4.1% and hours increase, then weekly earnings will grow by 4.2% to 4.3% next year.
- 2.2% adjusted for inflation earnings growth for regular workers in the next 12 months.
Construction employment rose by 34,000 in August, higher than the average monthly gain of 19,000 over the prior 12 months. Over the month, heavy and civil engineering construction added 14,000 jobs, and employment in nonresidential specialty trade contractors continued to increase (+14,000).” – Bureau of Labor Statistics.
Despite a horrible housing market, construction jobs, fueled by the $1.8 trillion in infrastructure spending (over ten years), continue to pick up.
Health care added 31,000 jobs in August, about half the average monthly gain of 60,000 over the prior 12 months. Employment rose in ambulatory health care services (+24,000) and hospitals (+10,000). Employment in social assistance continued its upward trend (+13,000) but at a slower pace than the average monthly gain over the prior 12 months (+21,000). Individual and family services added 18,000 jobs over the month.” – Bureau of Labor Statistics.
Services continued to generate strong growth in jobs, especially healthcare.
- Silver Tsunami effect (aging population and baby boomers needing healthcare).
Manufacturing employment increased in August (-24,000), reflecting a decline of 25,000 in durable goods industries. Manufacturing employment has shown little net change over the year.” – Bureau of Labor Statistics.
The industrial recession continues, as it has for over a year since the economic reopening led to a boom in services and negative growth in durable goods.
What’s Going On With Inflation: Deflation Remains Very Strong
Real wage growth is running very strong, courtesy of a big increase in productivity.
Productivity of 2.5% indicates that 2% inflation would permit 4.5% wage growth.
- And support 2.9% long-term GDP growth, according to the Bureau of Labor Statistics.
- Vs. 1.8% long-term consensus/Fed/Congressional Budget Office expectations.
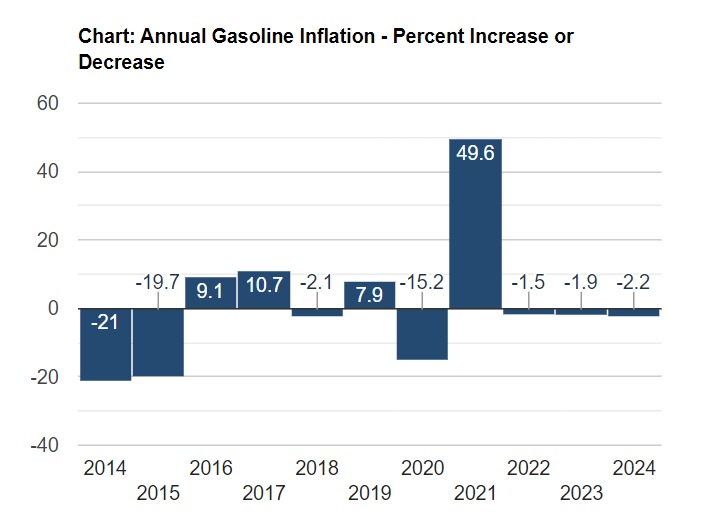
With US gasoline demand having peaked, this bodes well for gas and diesel prices, critical components of input costs, and inflation.
FactSet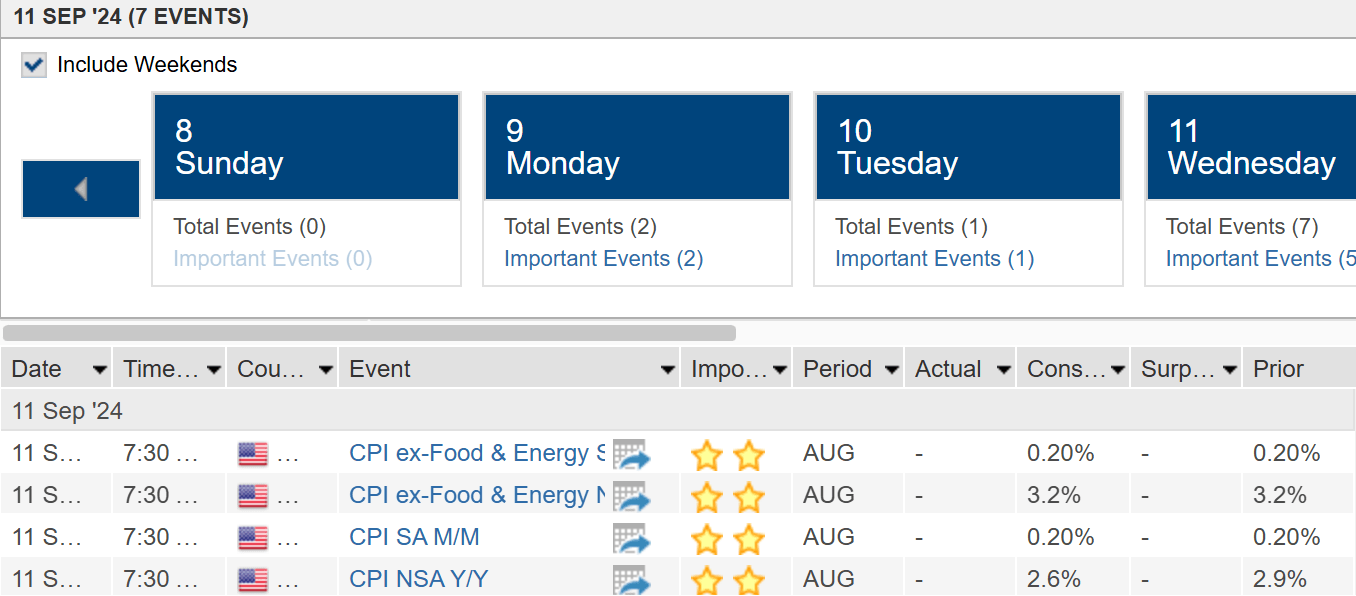
The next inflation report is due on September 11th, and the consensus is that 2.6% will be down from 2.9% last month.
The monthly inflation rate was 0.2%, annualized to 2.5%.
- Consistent with 2% core PCE (the Fed’s official metric).
Cleveland Fed Real-Time Inflation Nowcast
Cleveland Federal Reserve 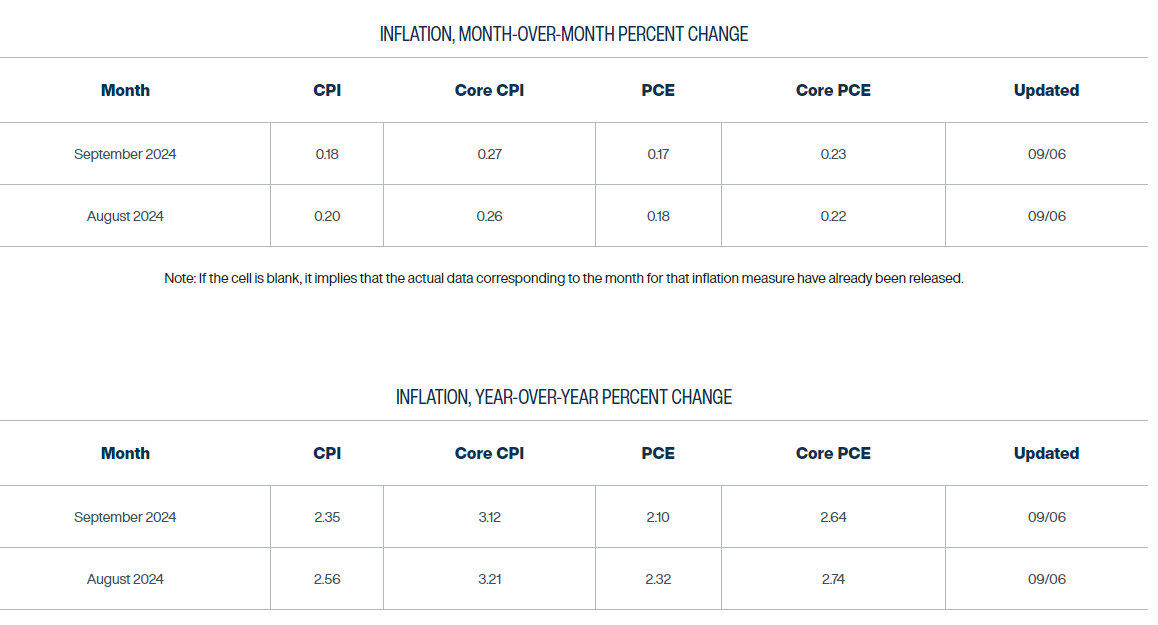
The Cleveland Fed estimates 2.6% for this coming inflation report and 2.35% next month.
At the end of September, 2.7% core PCE is expected, followed by 2.6% next month.
Charlie Bilello 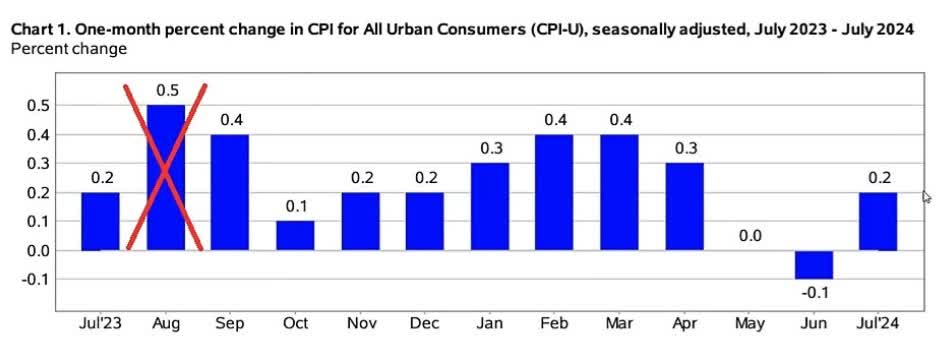
Inflation works because the 12th month is dropped, and the new month is added.
That’s why economists and the Cleveland Fed expect a decline of 0.3% in Year-over-Year inflation in September.
Then, there was another 0.25% decline in October.
2.5% to 2.6% in September.
2.3% to 2.4% in October.
Then 2.4% to 2.5% in November.
2.4% to 2.5% in December.
2.3% to 2.4% January.
2.1% to 2.2% in Feb.
1.9% to 2% in March.
1.8% to 1.9% in April.
2.0% to 2.1% in May.
2.3% to 2.4% in June.
2.3% to 2.4% in July.
If monthly inflation remains at 0.2% for the next year, then CPI inflation will bottom at 1.8% to 1.9% in April and return to about 2.4% by August 2025.
However, monthly inflation could dip to 0.1% and thus drive CPI as low as 1.3%.
10 Million Daily Data Point Real-Time Inflation
Truflation 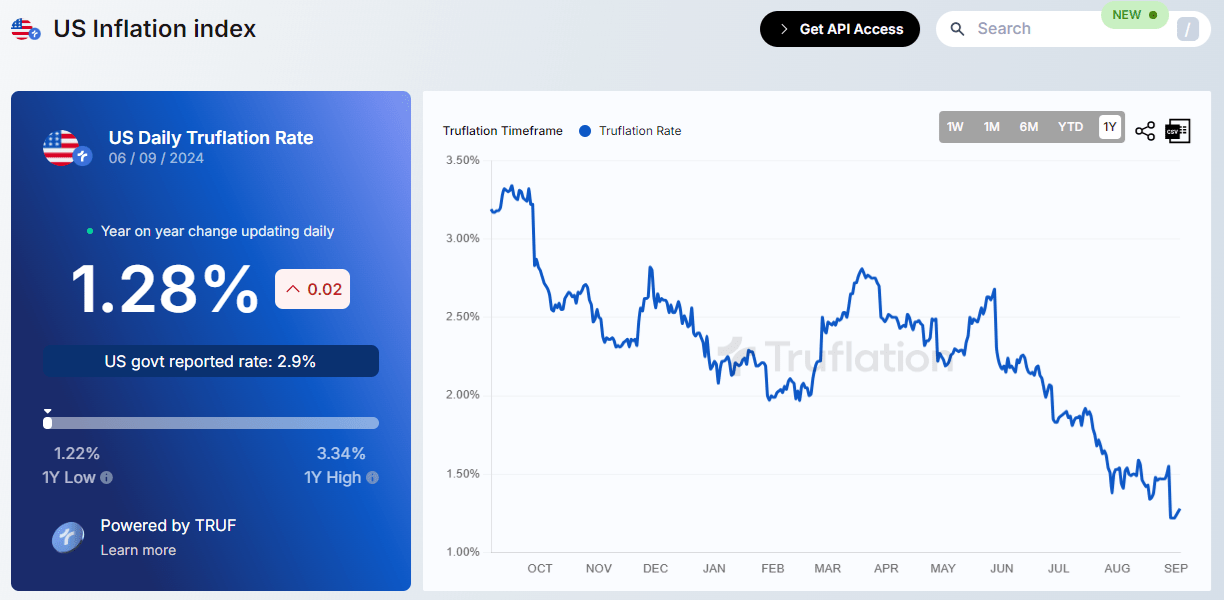
Truflation is the best real-time inflation source, based on 10 million daily updated prices.
It’s been 97% correlated to CPI since 2012 and is also a useful proxy for where the Fed could fundamentally justify cutting rates if today’s inflation trends hold.
1.3% CPI = 0.8% Core PCE vs. 2% target = Fed cuts rates 1.2% below neutral rate = 1.3%.
In other words, the True Inflation rate would be approximately equal to the Fed Funds rate if it were 100% automated and run on real-time inflation data.
What’s Going On With Interest Rates
Daily Chartbook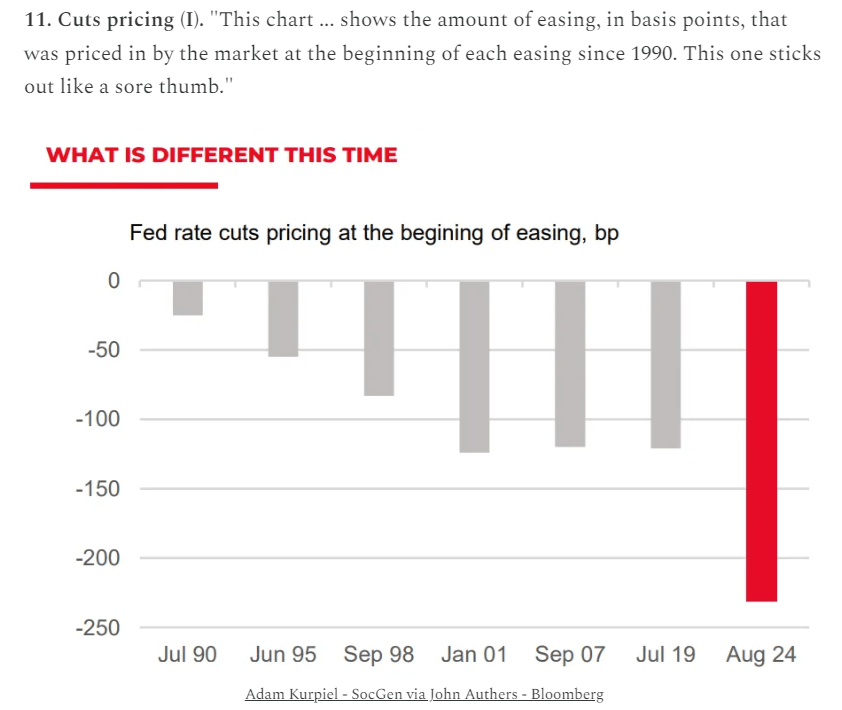
The bond market has priced in 9 rate cuts before the Fed has even cut once.
I recently warned that bonds would be modestly overpriced if we avoided a recession.
Long-term, the consensus is for 4.14% 10-year Treasury yields (US10Y); we’re at 3.7% right now.
- 1.8% long-term GDP growth + 2.3% inflation = 4.1% nominal GDP.
Long-term interest rates closely track nominal GDP.
If there is no recession, bond yields will go up.
The Fed controls the short end of the curve, not the long end.
Daily Shot 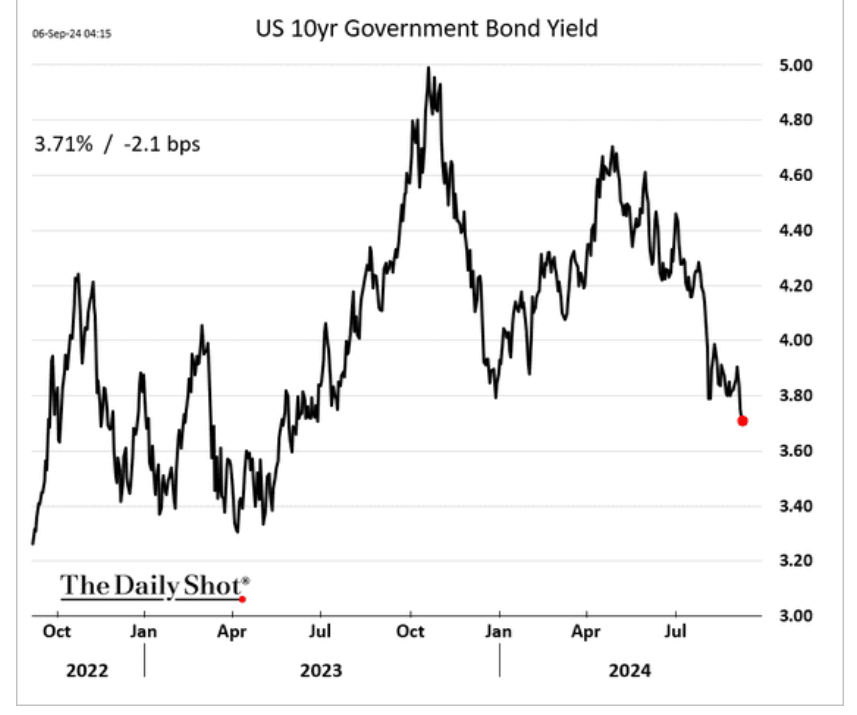
The Fed finished hiking in June 2023 and has kept rates at 5.25% since then.
Long bond yields are based on economic growth expectations, long-term inflation expectations, and a term premium based on expectations of bond supply vs. demand (deficit spending increases bond yields).
Daily Shot 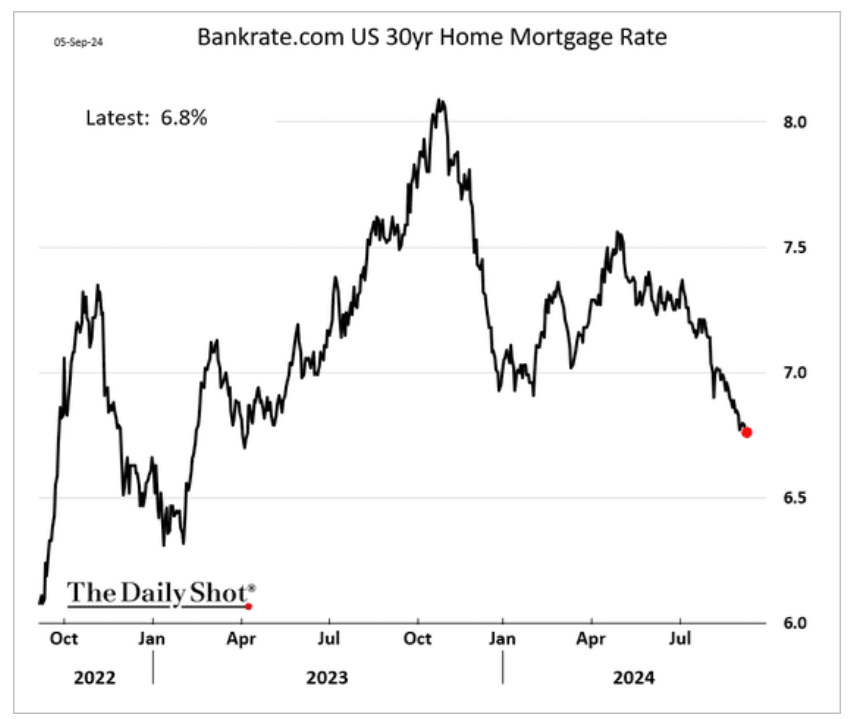
Mortgage rates are indexed to 10-year treasuries, so mortgage rates have fallen to “just” 6.8%, causing a spike of more than 30% in refinancing.
The bond market now expects the Fed to cut to 2.75% and stop, matching the Fed’s most recent guidance.
Daily Shot 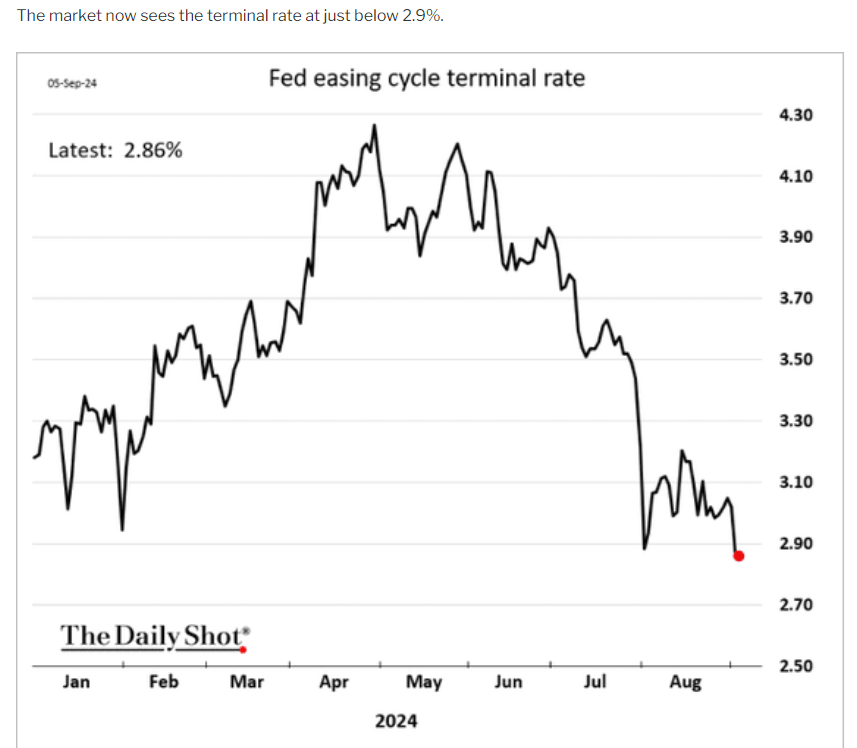
The terminal rate is the bond market’s estimate for a “neutral interest rate” at which the Fed neither accelerates nor slows the economy.
This is the “smart money” estimate for the natural interest rate of our economy.
Long-term inflation expectations are 2.3%, which means about 0.5% long-term risk-free real yield on cash.
YCharts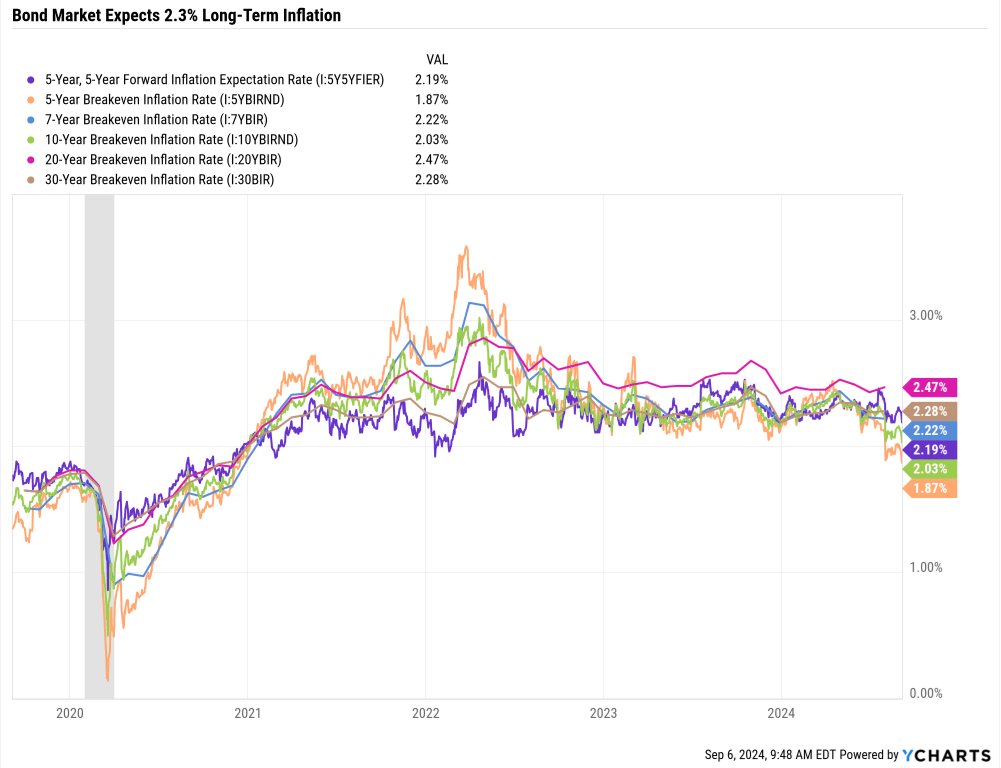
The inflation-adjusted cash yield (t-bills) has averaged 0.5% for the last century.
This is the natural rate of risk-free yield.
The bond market expects rates to fall rapidly.
CME Group CME Group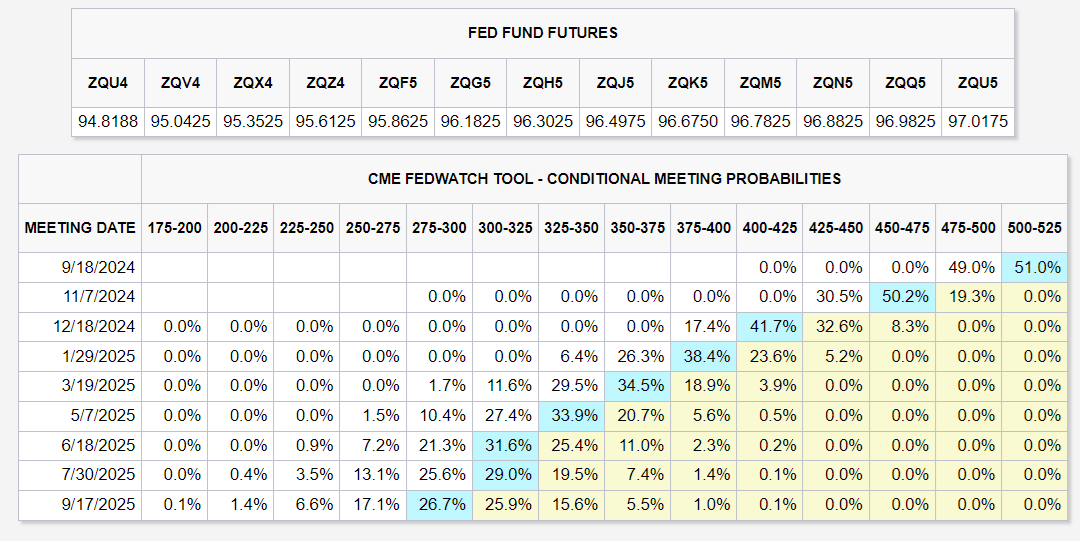
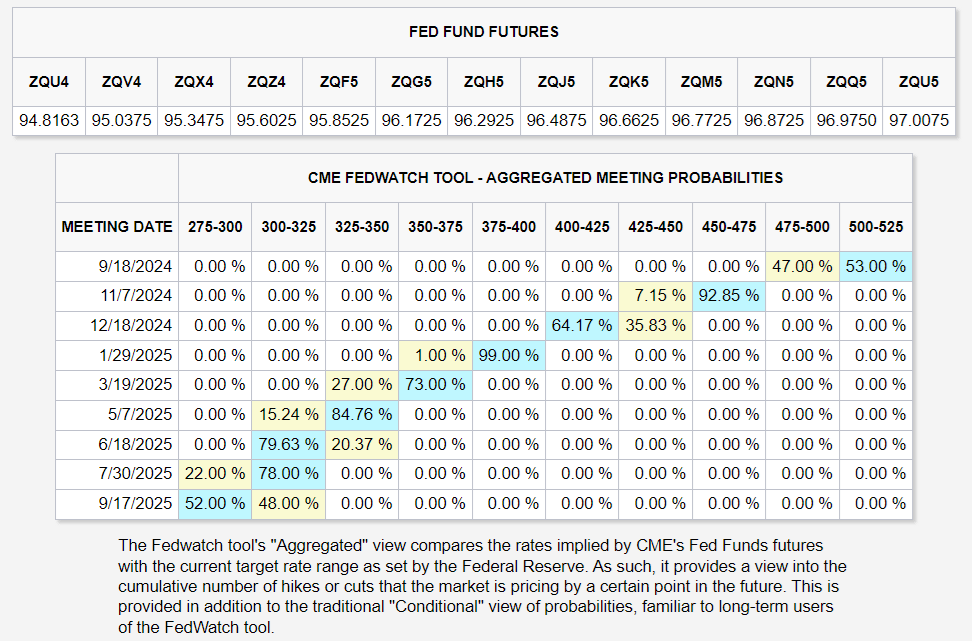
According to the bond market, the Fed will likely cut 25 in September, another 50 in November, another 50 in December, 25 more in January, 25 in March, 25 in May, 25 in June, and possibly 25 in September.
These estimates change in real-time. They tell us what is priced into bond yields at this exact moment.
- If a recession were predicted, the Fed would slash rates faster than 25 or 50 basis points at a time.
- And it would not stop at neutral.
By definition, in a recession, the Fed must cut below neutral.
The bond market, the “smart money” on Wall Street, is pricing in a soft landing.
My educated guess is the same as that of former Treasury Secretary Paulson.
Fed cuts 0.25% every meeting through the end of 2025 to 2.5%.
Recession Watch: Fighting Fear With Facts
Daily Shot Daily Shot Daily Shot 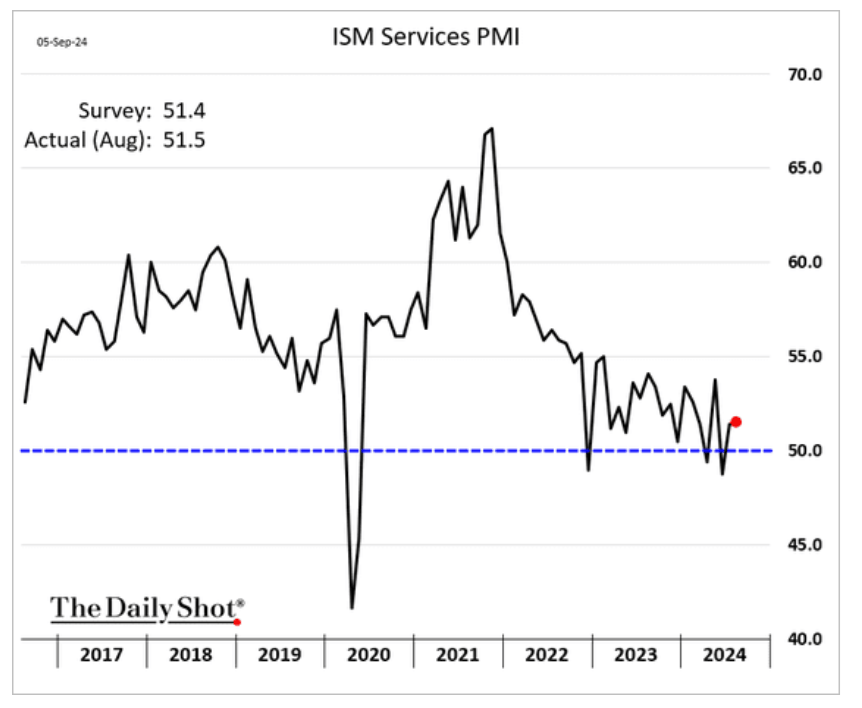
The Manufacturing PMI came in weak on Tuesday, triggering a 2.1% S&P decline on a growth scare.
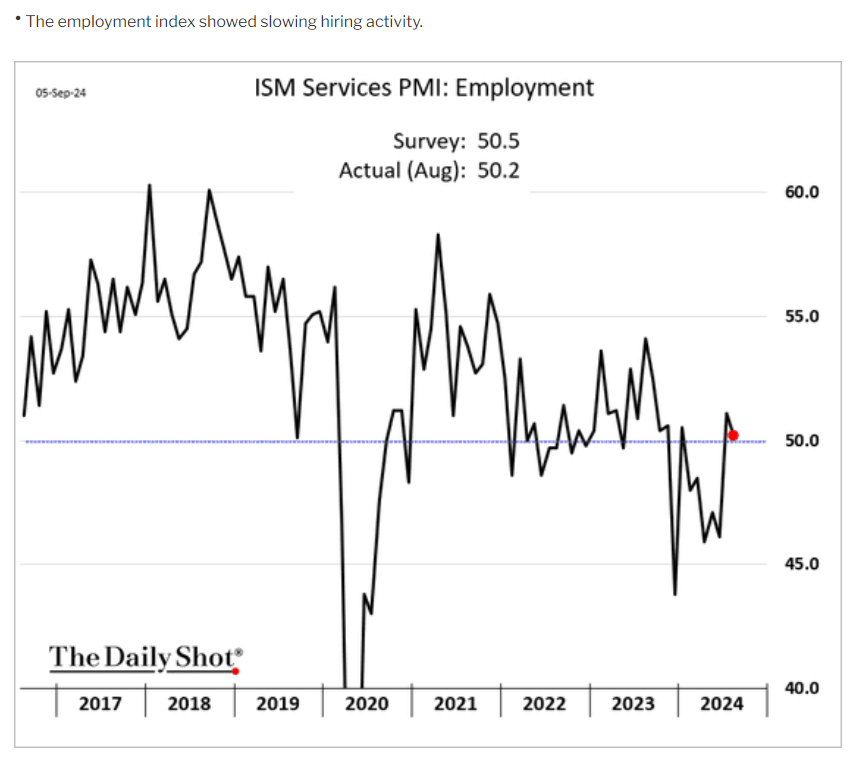
Services are a 6X more significant part of the economy than manufacturing, and services are steady.
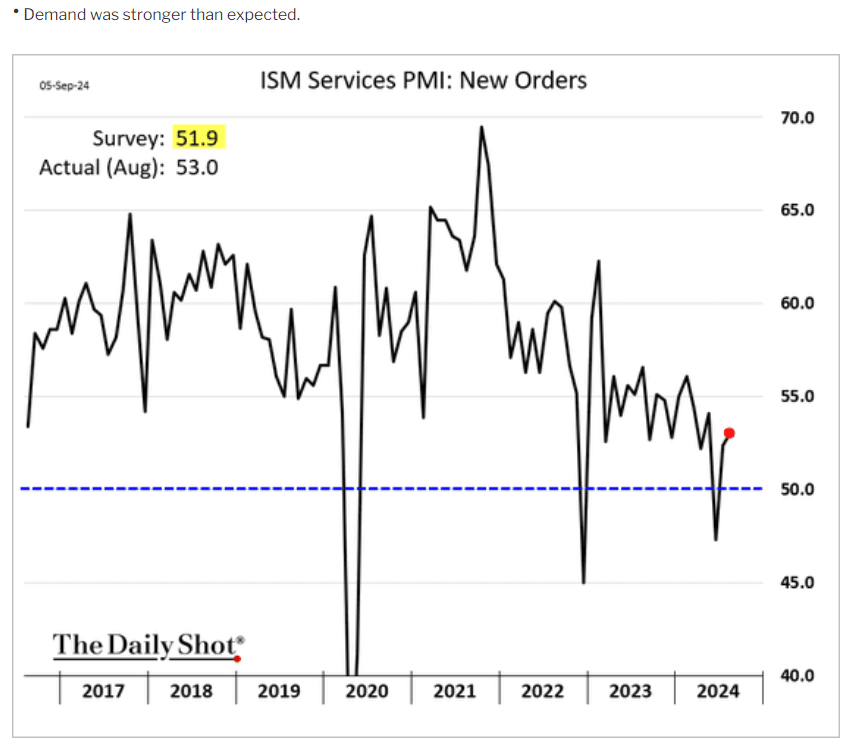
Demand for services is stronger than expected and continues to expand. While service hiring has slowed, it remains positive.
Daily Shot 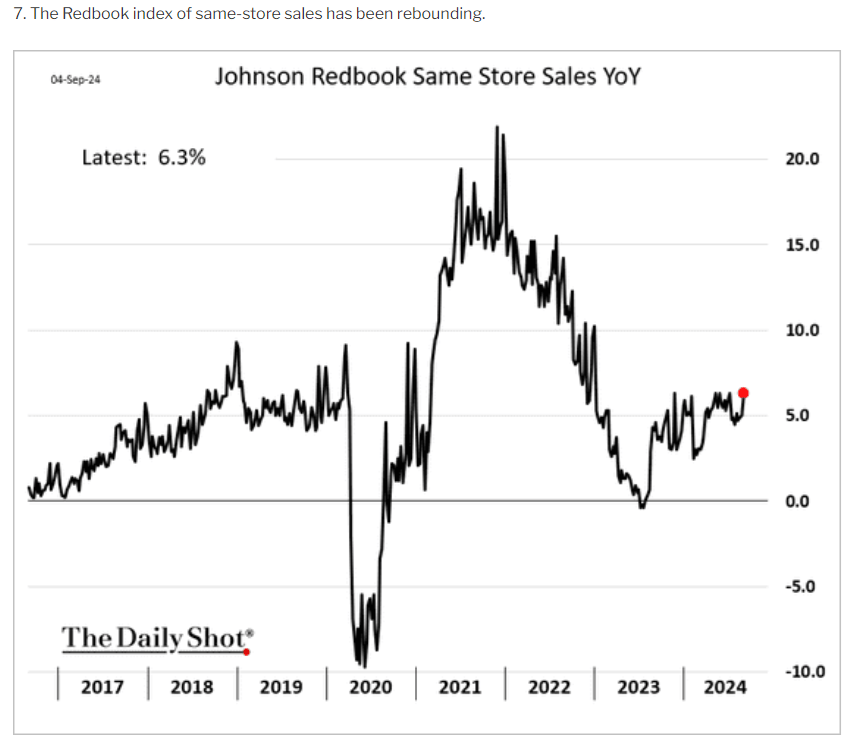
Same-store retail sales are now growing at over 6%, 4.4% adjusted for inflation.
65% of GDP is consumer spending, and consumer spending remains not just resilient but improving.
- Credit card rates track the Fed Funds rate.
- Home Equity Lines of Credit offer consumers $11 trillion in tappable home equity they can borrow against.
Daily Shot 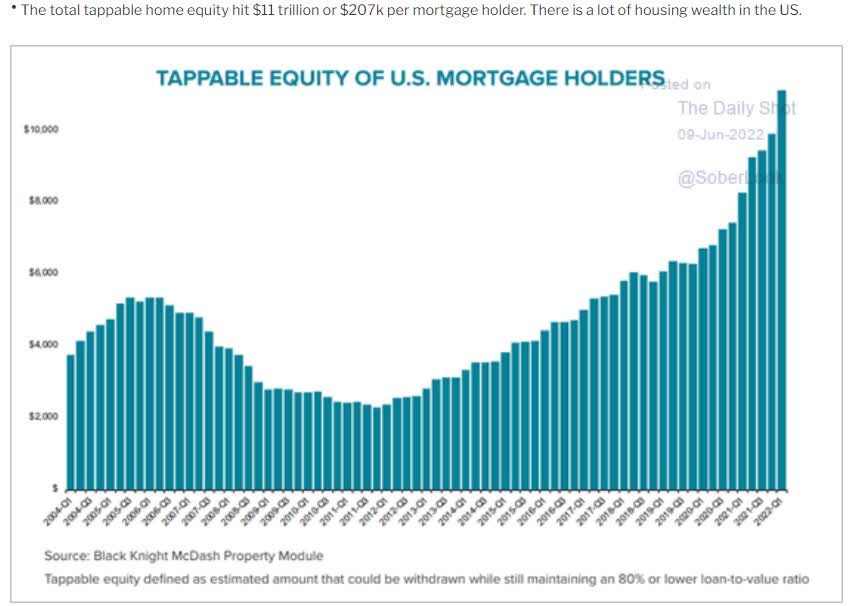
For context, US consumer spending is $19 trillion per year.
Daily Chartbook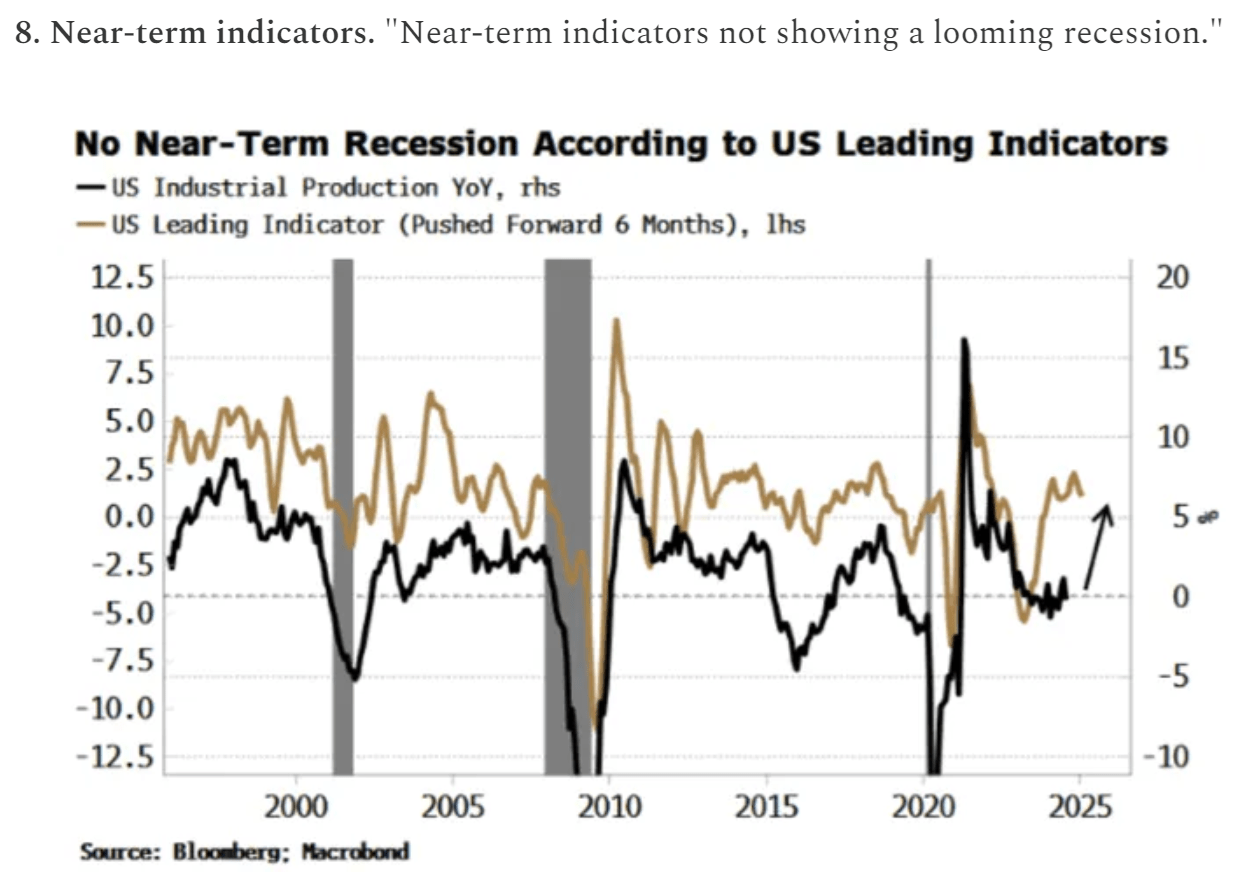
Bloomberg reports no near-term recession.
Daily Chartbook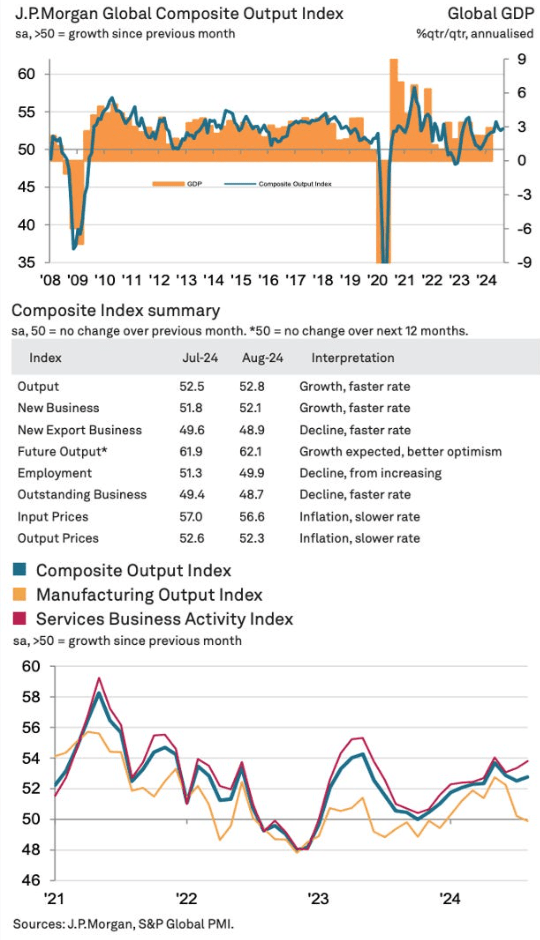
JPMorgan reports global economic growth is accelerating, which is a favorable tailwind for US growth.
Weekly Real-Time Recession Watch
Here are the ten real-time indicators we now have to track the economy.
- Atlanta Fed GDPNow
- New York Fed GDPNowcast
- St. Louis Fed GDPNowcast
- NY Fed’s Weekly Economic Index
- Baseline and Rate of Change Economic Grid
- Silver Bulletin Economic Index
- St. Louis Fed Financial Stress Index
- Kansas City Fed Financial Stress Index
- Chicago Fed National Financial Condition Index
- NDD’s weekly real-time indicator report.
These ten models cover over 150 non-overlapping weekly updated metrics that cover every part of the US economy.
While there is no 100% sure way to predict recessions, these ten combined models ensure we will never be surprised by a downturn. If one is coming, we’ll see it coming several weeks or months in advance.
Atlanta Fed GDPNow: 2.1% Growth
Atlanta Fed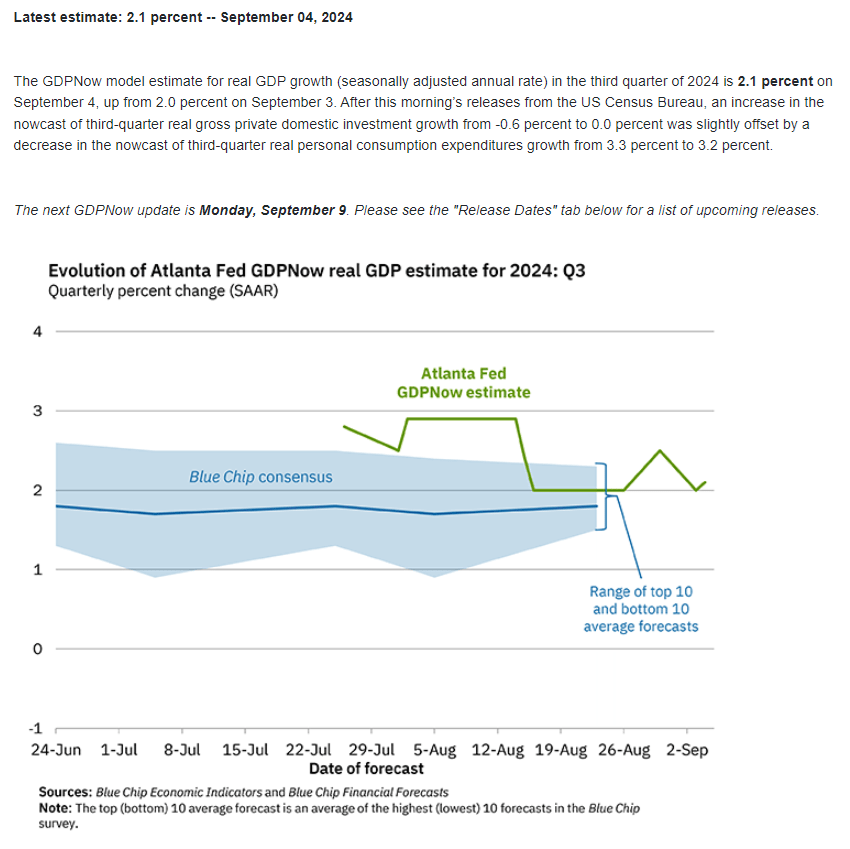
New York Fed GDPNowcast: 2.5% Growth
NY Fed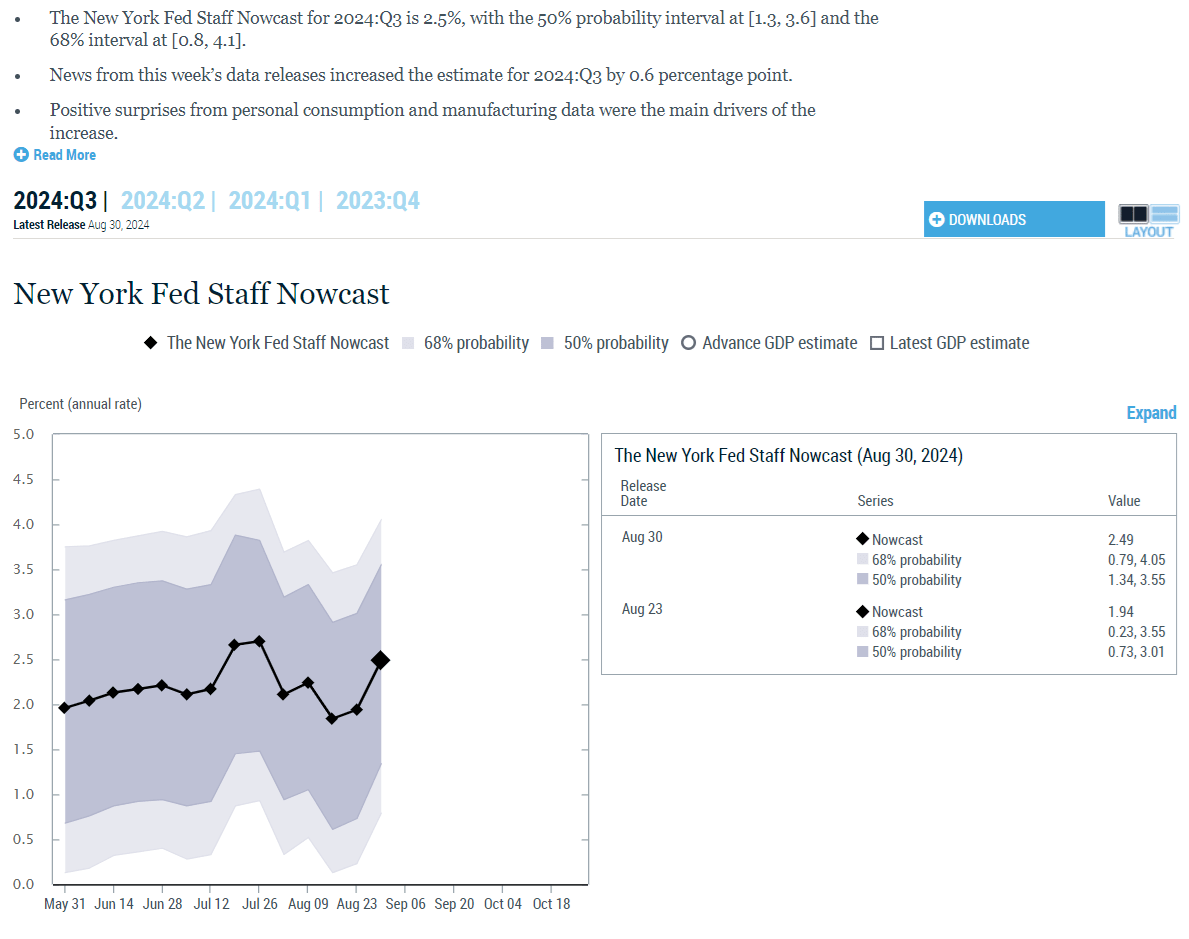
St. Louis Fed GDPNowcast: 2.1% Growth
St. Louis Fed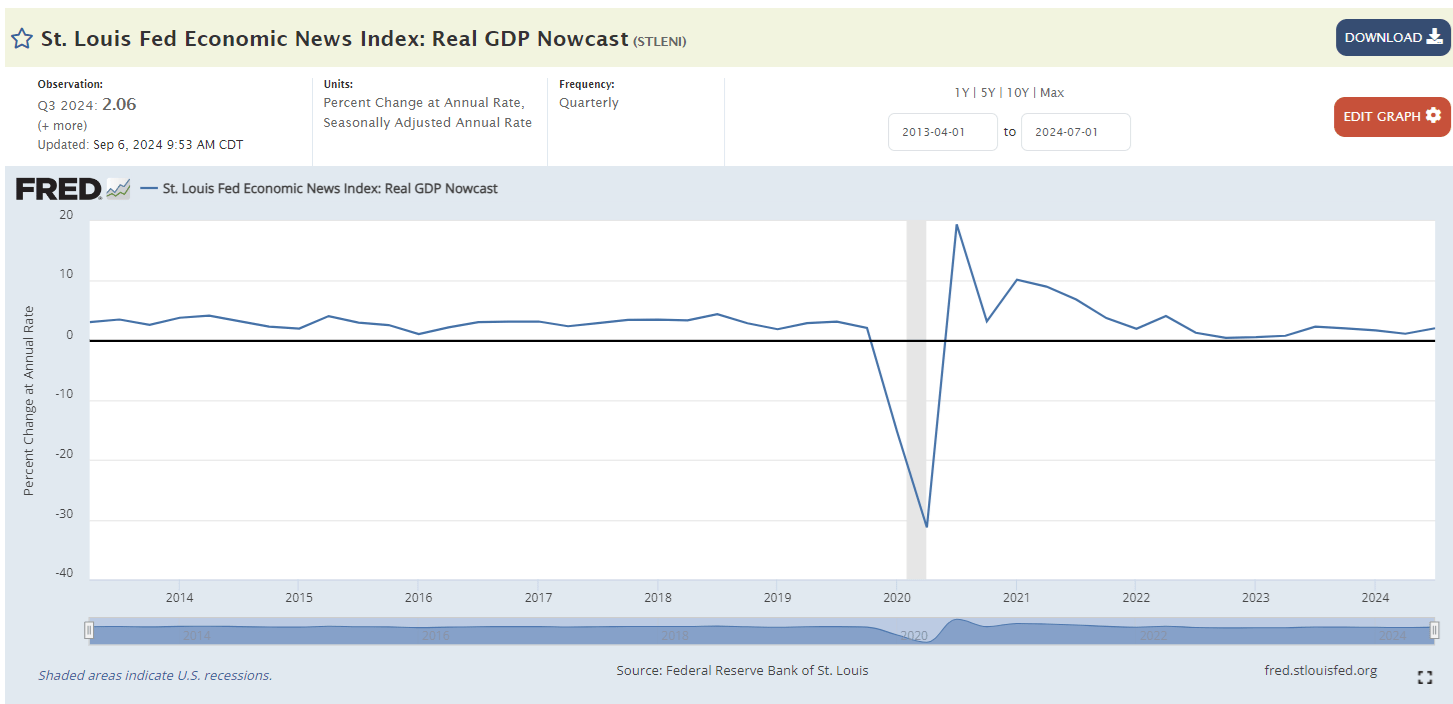
Dallas Fed’s Weekly Economic Index
The WEI index real economic activity using timely and relevant high-frequency data.
It represents the common component of ten different daily and weekly series covering consumer behavior, the labor market, and production. The WEI is scaled to the four-quarter GDP growth rate; for example, if the WEI reads -2 percent and the current level of the WEI persists for an entire quarter, one would expect, on average, GDP that quarter to be 2 percent lower than a year previously. The WEI is a composite of 10 weekly economic indicators:
- Redbook same-store sales
- Rasmussen Consumer Index
- new claims for unemployment insurance
- continued claims for unemployment insurance
- adjusted income/employment tax withholdings (from Booth Financial Consulting)
- railroad traffic originated (from the Association of American Railroads), the American Staffing Association Staffing Index
- steel production
- wholesale sales of gasoline diesel, and jet fuel
- weekly average US electricity load (with remaining data supplied by Haver Analytics).
- All series are represented as year-over-year percentage changes. These series are combined into a single index of weekly economic activity.” Dallas Fed.
Dallas Fed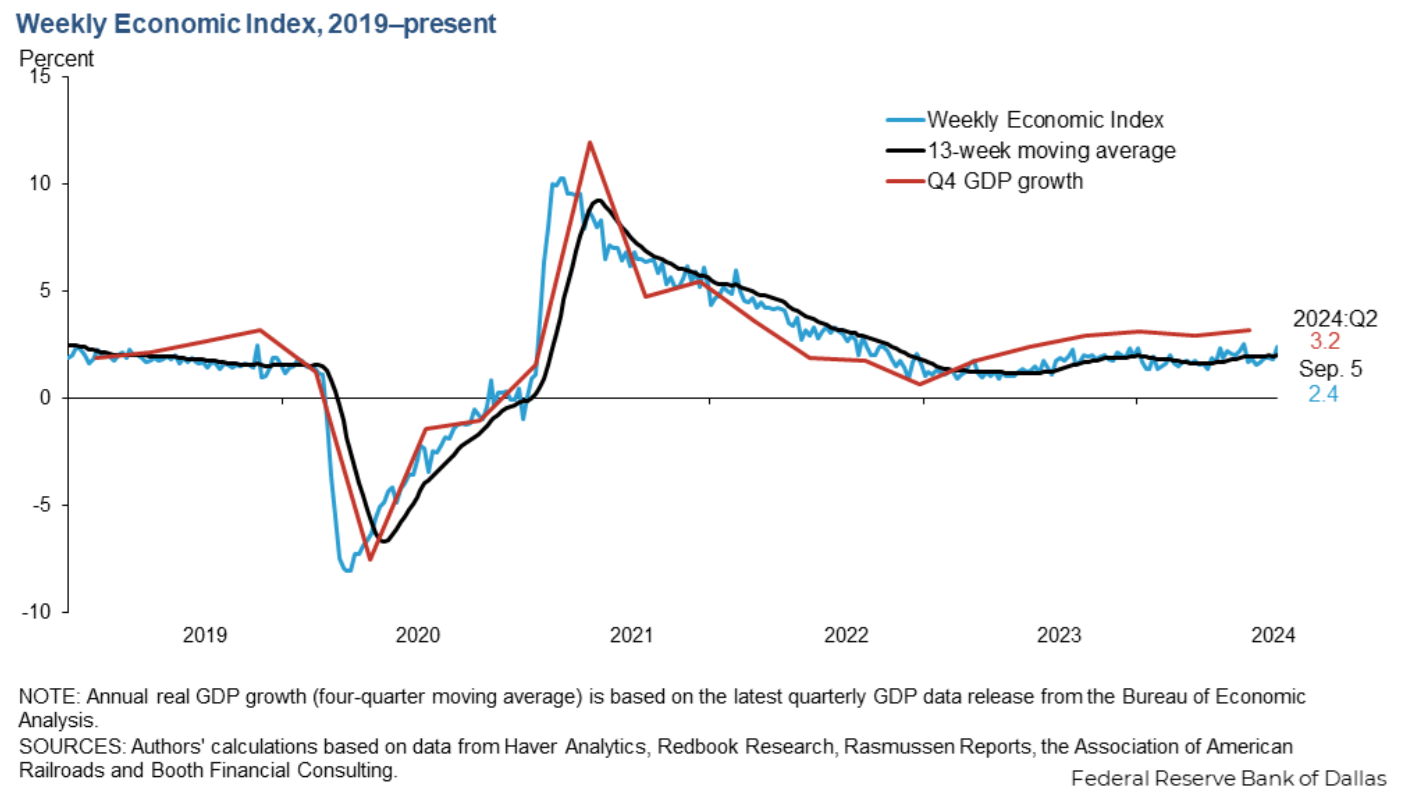
The Dallas Fed estimates that if today’s economic data were to hold, the economy would grow 2.4% faster in 12 months.
- 3% GDP growth in Q2 2.4% = 5.4% potential GDP growth in Q2 2025.
- Last week, the index was 2.27%, indicating 5.27% potential growth in Q2 2025.
For three consecutive weeks, the economy has appeared to be slightly accelerating.
Baseline and Rate of Change Economic Grid
David Rice 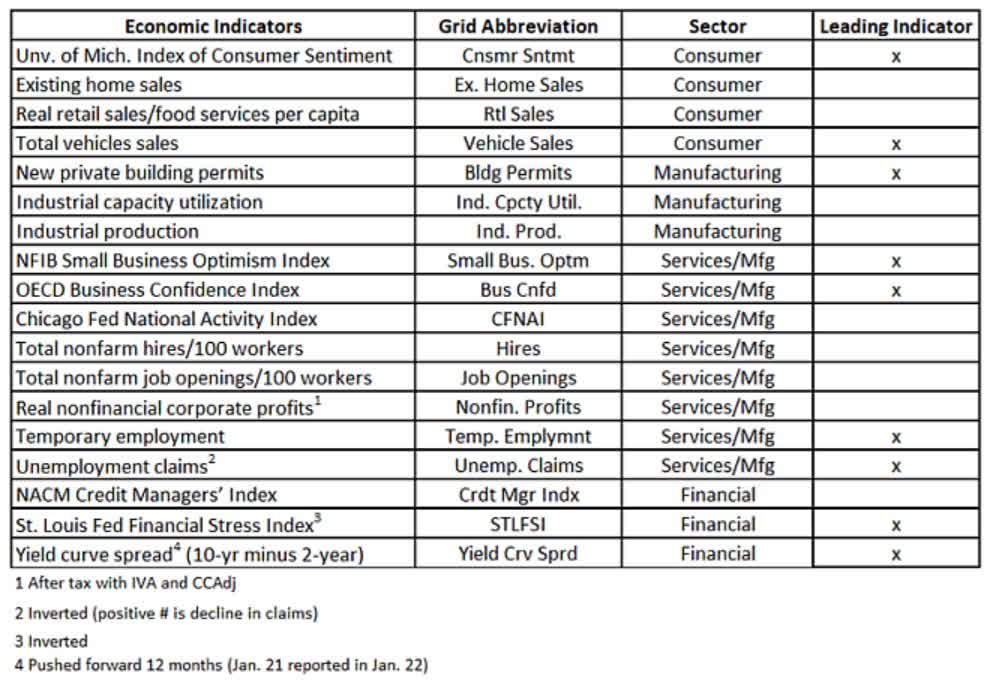
David Rice plots 19 economic metrics and nine leading indicators each week on a grid, comparing each to its historical baseline level over the last three decades.
And also the rate of change compared to last month.
David Rice 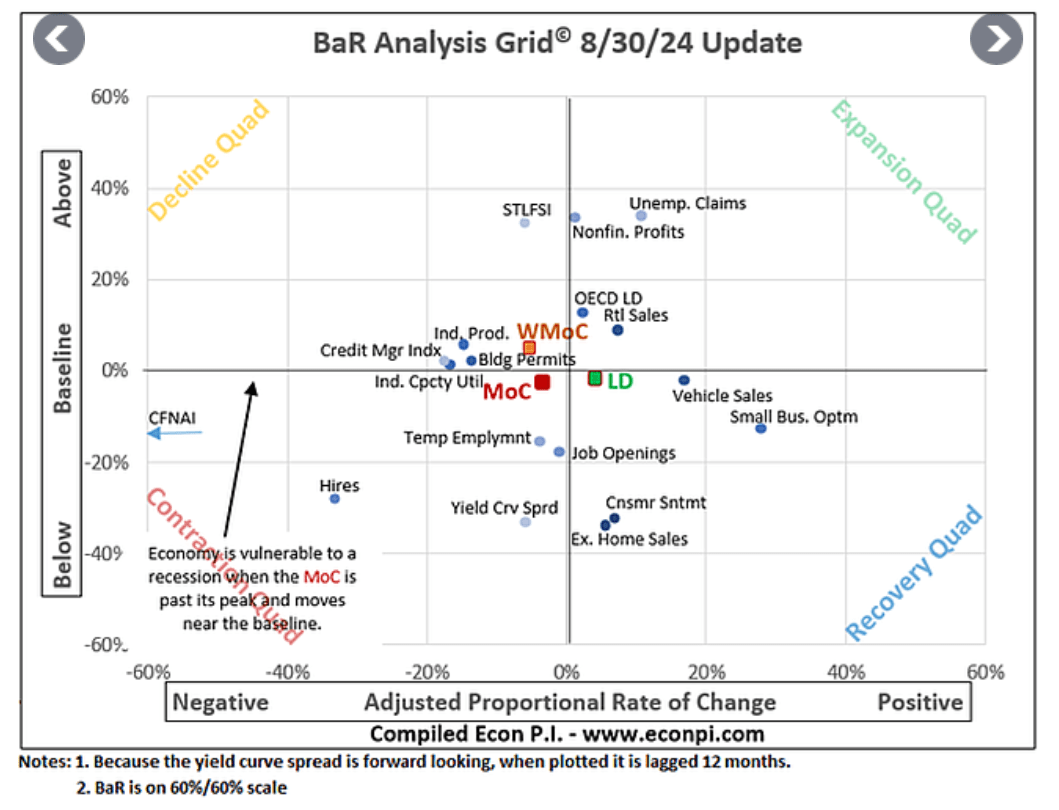
The economy is currently slightly above average (1.8% trend growth) but decelerating.
That’s what the Fed wants.
The leading indicators point to below-trend growth but are accelerating, thus the position in the recovery quadrant.
The economy is starting to pick up again, and we haven’t had a single rate cut yet.
David Rice 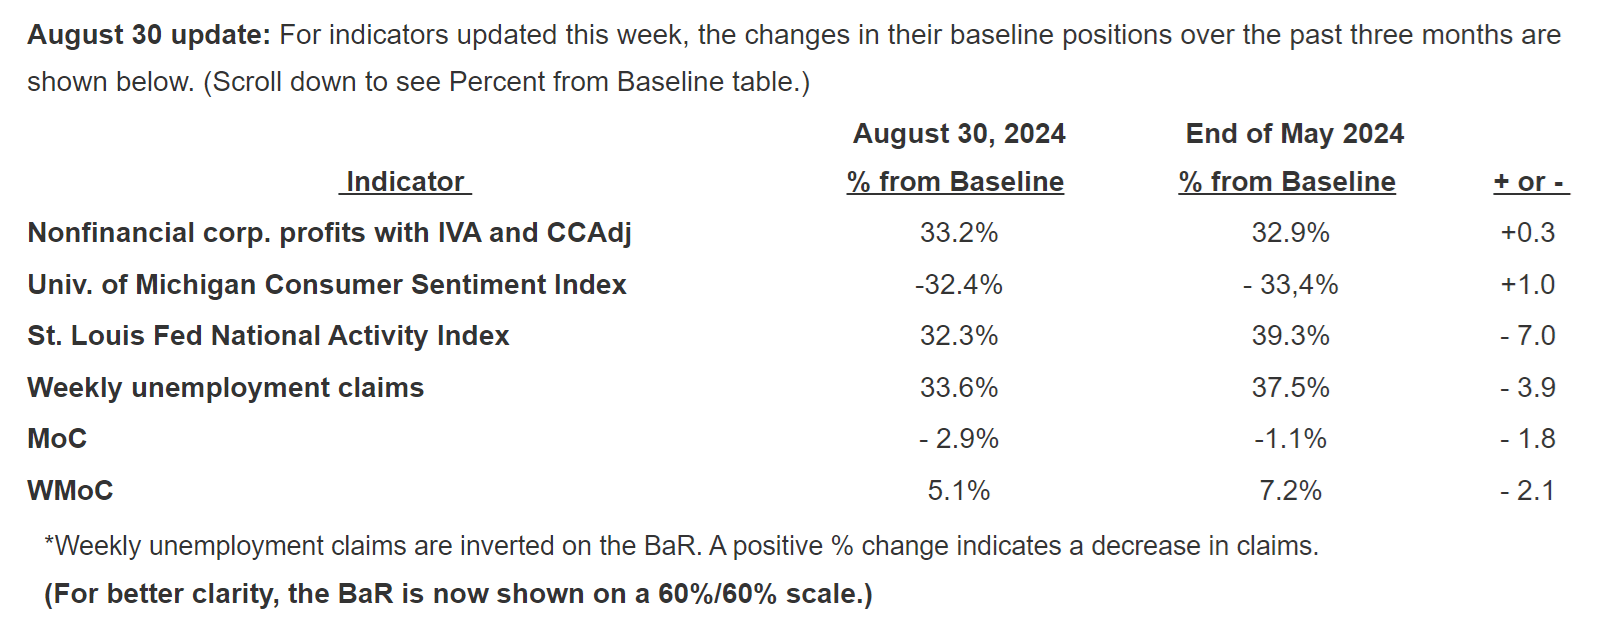
Consumer sentiment is recovering, likely due to gas and grocery prices beginning to come down.
Ritholtz Wealth Management US Inflation Calculator Wallet Hub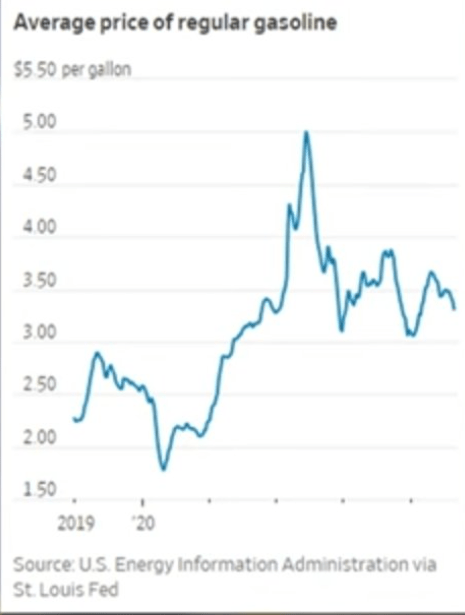
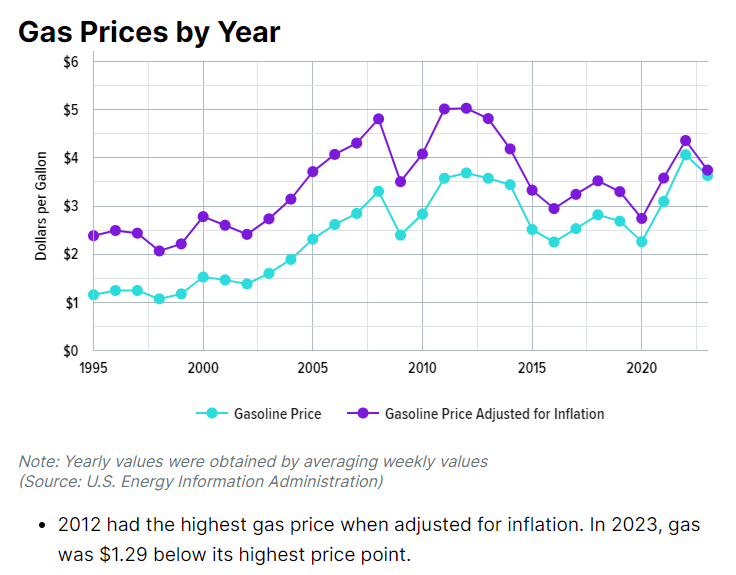
Gasoline prices, adjusted for inflation, peaked in 2012 and are now $3.5 and, in my area, $3.
US Inflation Calculator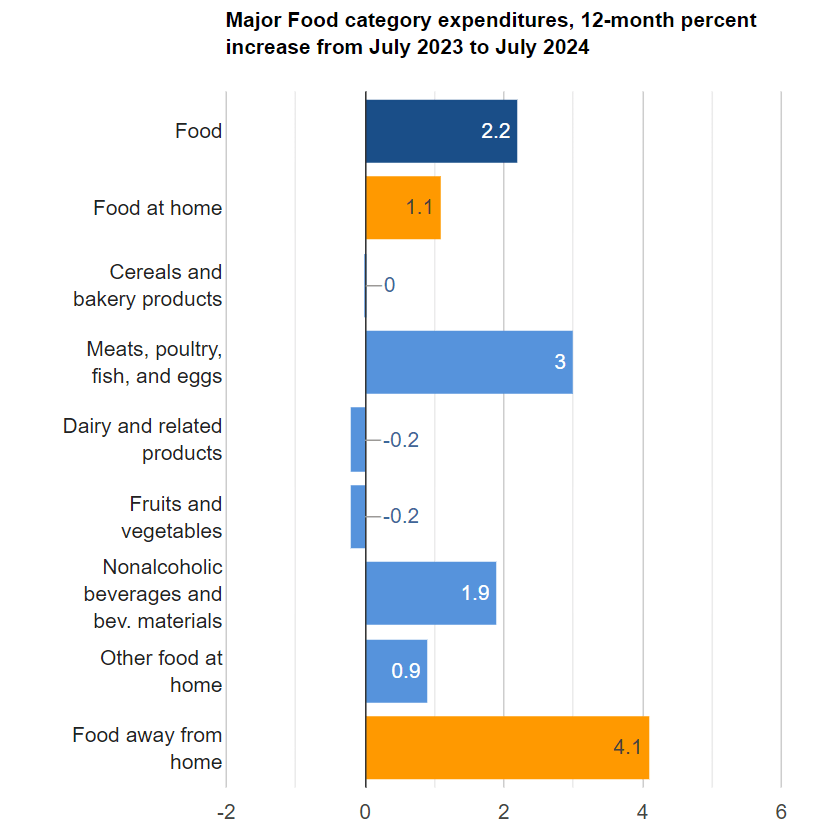
Walmart has started cutting grocery prices and is now losing money on groceries.
YCharts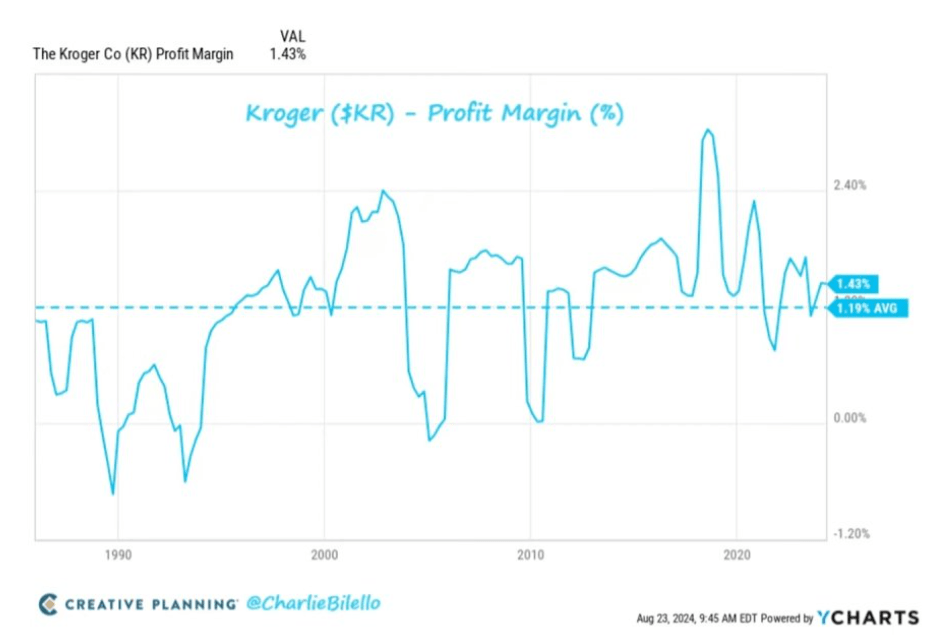
Kroger (KR), the largest Grocery chain, has not been price gouging; it’s profit margin has been relatively stable at 1.2%, compared to the S&P’s 12%, for decades.
YCharts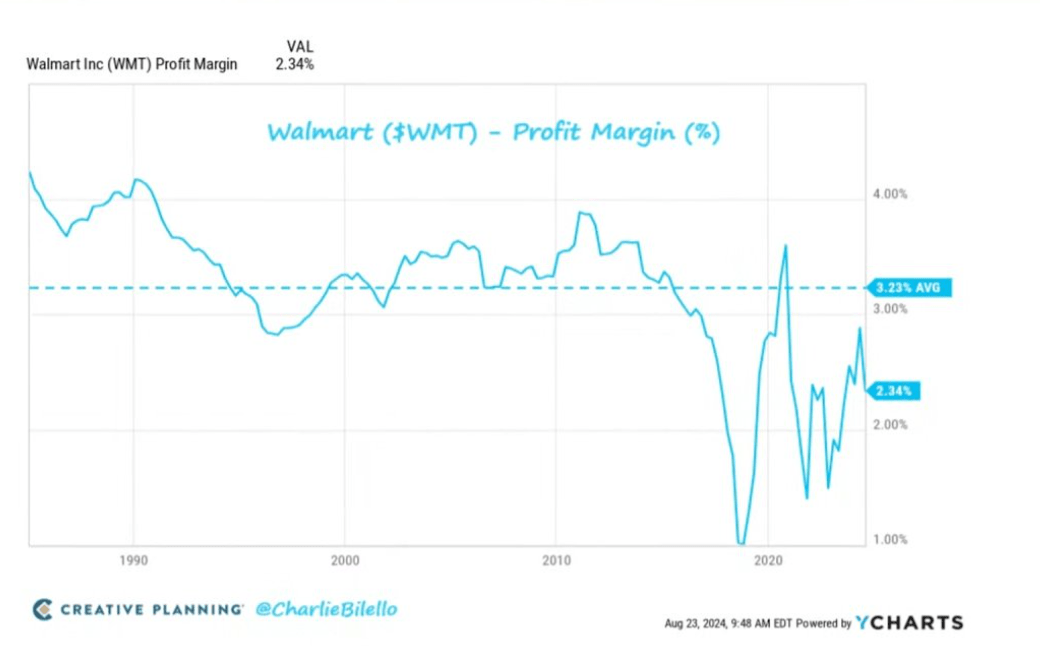
Walmart (WMT) has seen its margins fall over time and now earns a net profit of 2.34 cents per dollar of sales.
David Rice David Rice 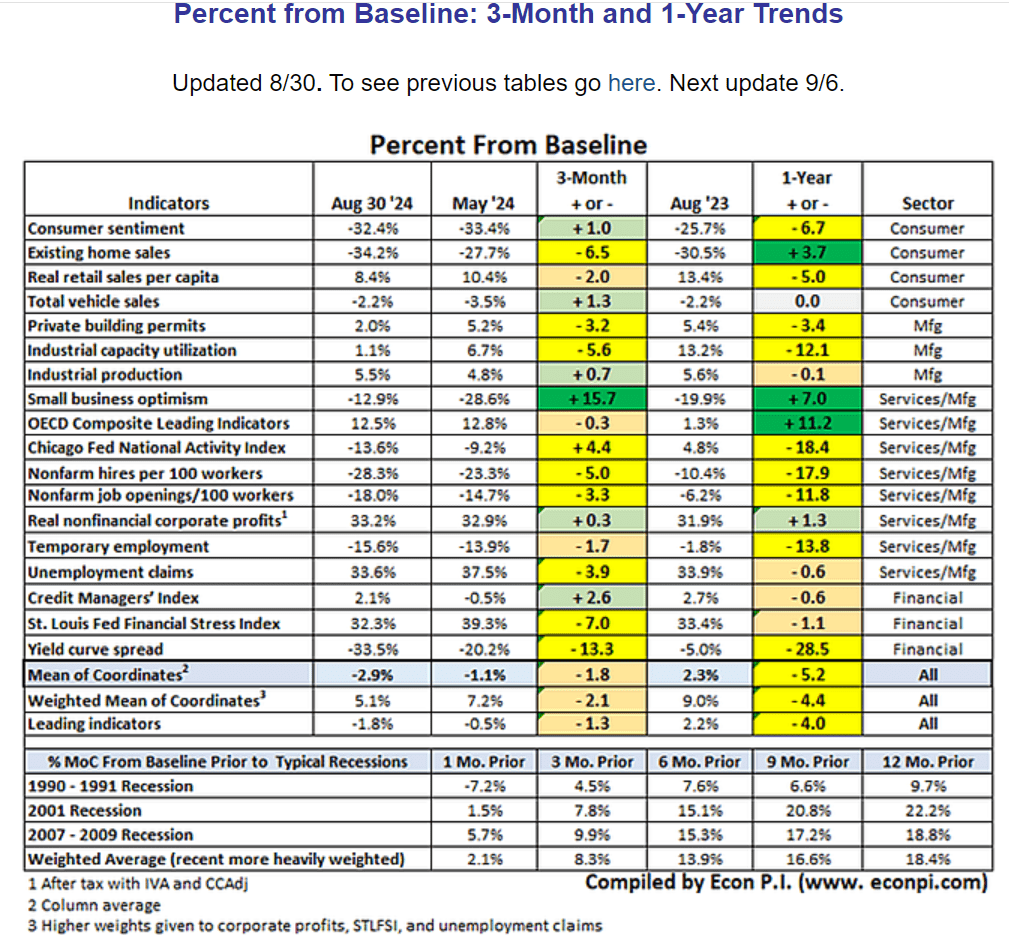
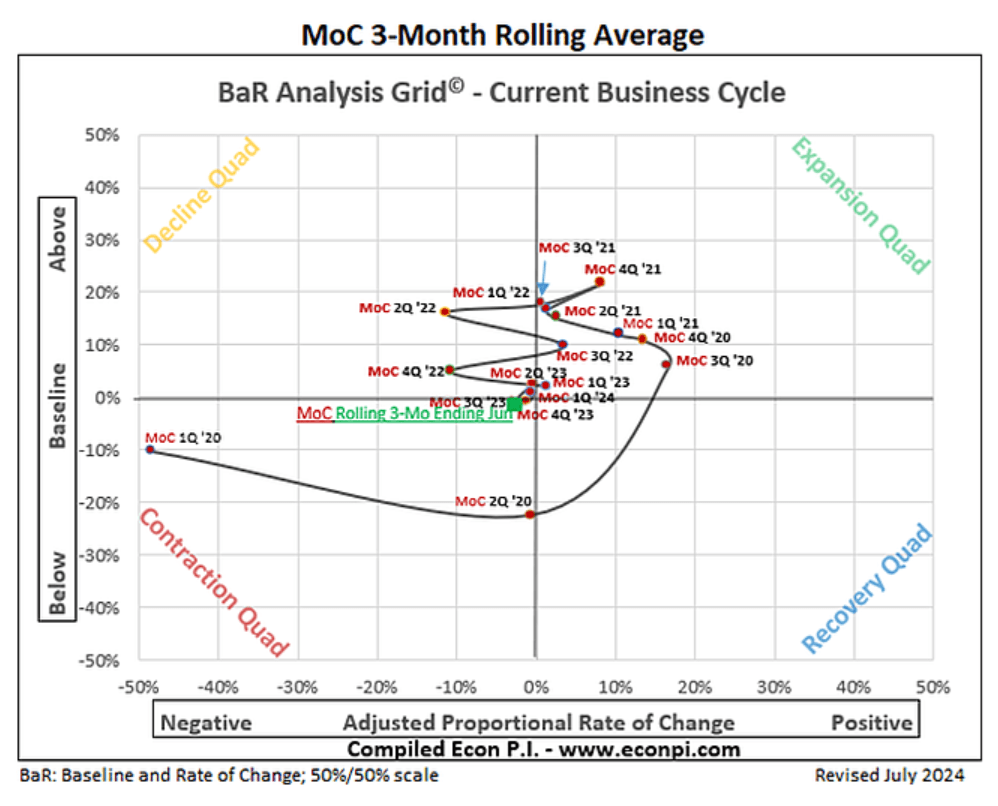
Peak growth (6.9% GDP) occurred in Q4 of 2021, and the fastest rate of economic acceleration occurred in Q3 of 2020 (17% improvement MoM).
Based on this, we can calibrate the following model.
- Each 1% above or below baseline is 23.2 basis points of growth.
- 1.8% below baseline (leading indicators) = -0.42% peak slowdown.
- 1.8% trend growth -0.4% slowdown = 1.4% minimum growth rate (1.4% later week, 1.3% two weeks ago, 1.0% three weeks ago).
The modest improvement in economic conditions appears to be holding.
The economy isn’t just a “soft landing;” we’re not even slowing below-trend growth. We keep chugging along in a “no landing” scenario.
Silver Bulletin Economic Index
As part of his political forecast, Nate Silver is tracking six historical economic indicators that have affected people’s perceptions of the economy.
Nate Silver 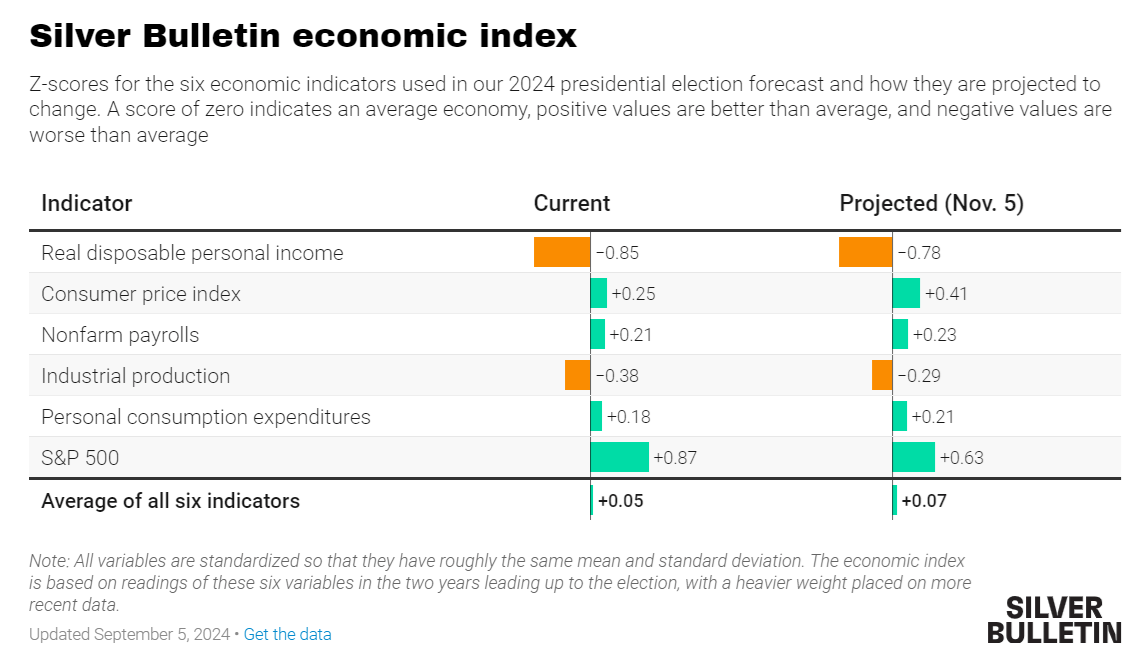
The economy is currently 0.05 standard deviation above its two-year rolling average and is expected to improve to 0.07 by election day slightly.
The stock market is expected to cool, but real wages are expected to improve, and industrial output is expected to recover. The most extensive improvements are expected to come from significantly better inflation.
St. Louis/Kansas City/Chicago Fed Financial Stress Index
Zero is calibrated to average financial stress since the inception of each index.
YCharts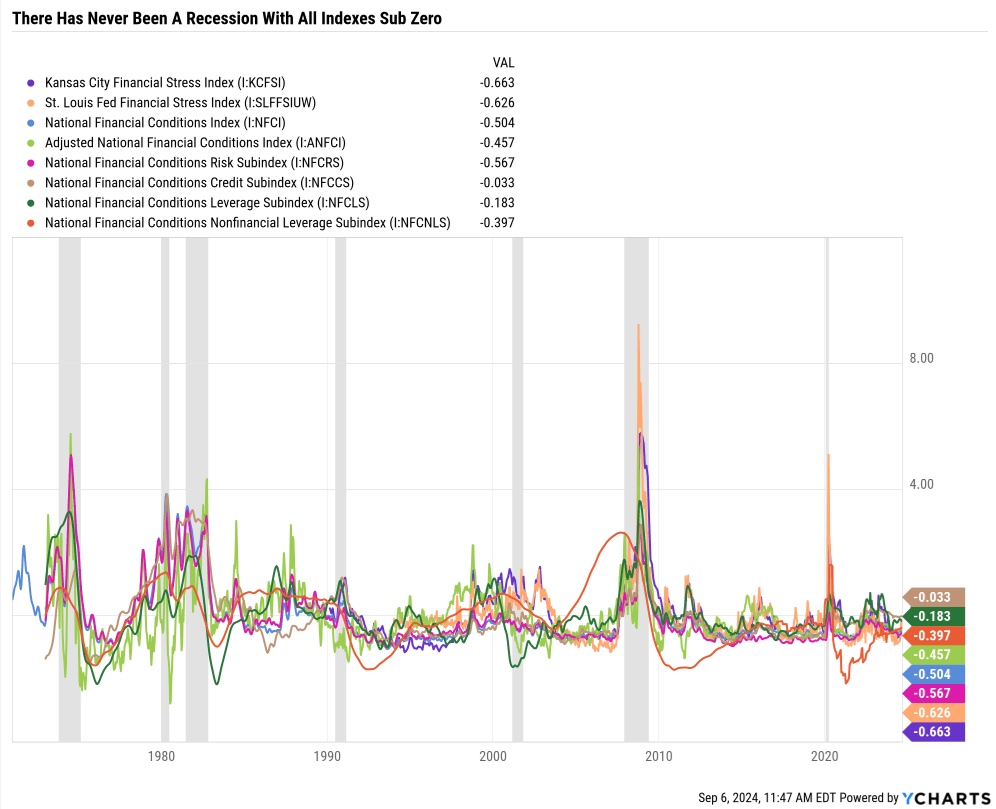
Negative numbers mean below-average financial stress.
Since 1971, there has never been a recession, with all indexes and subindexes below zero.
These three models cover over 120 weekly financial indicators.
Every part of the economy’s financial plumbing is represented, and if a recession were coming, we’d see it in this data.
YCharts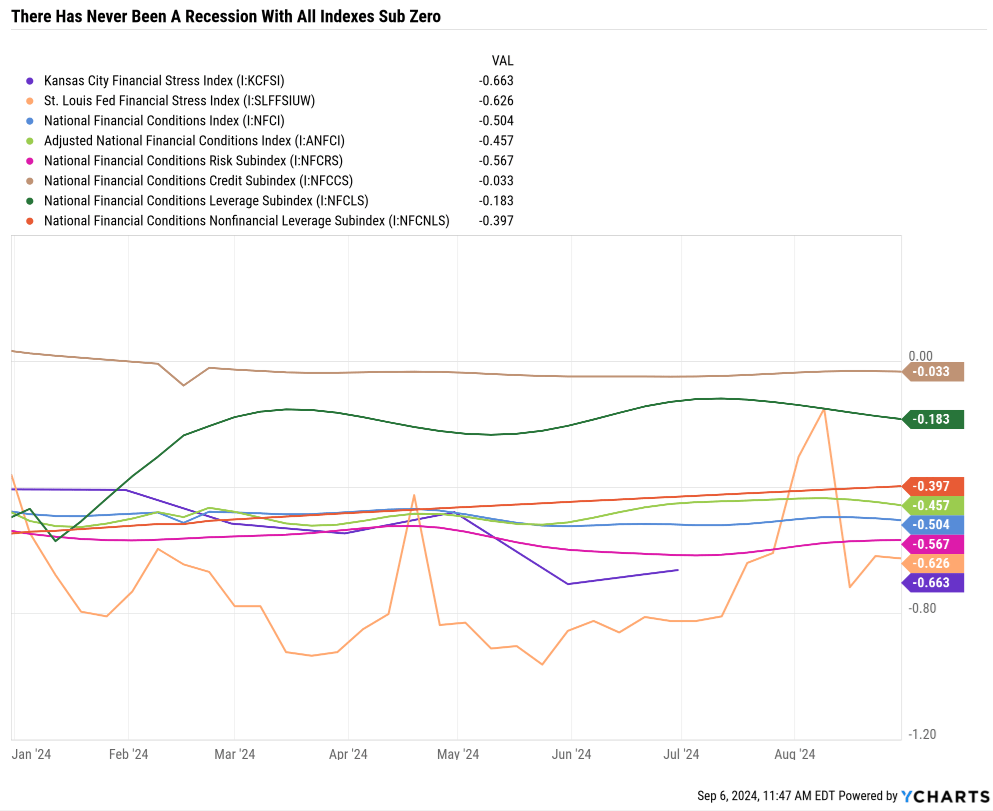
The indexes have been relatively stable all year.
The most significant movement was in the Chicago Fed’s leverage subindex, which picked up floating rate debt stress for small businesses.
Note that the leverage financial stress has been falling recently.
Non-financial leverage (which includes consumer debt) has fallen significantly recently.
NDD’s weekly real-time indicator report.
Summary
High-frequency weekly indicators provide a timely “nowcast” of the economy, signaling changes before monthly or quarterly data is available.
Long leading indicators are inching into neutral territory, with long-term bonds on the verge of turning positive and the 10-year minus 2-year Treasury spread nearly un-inverting.
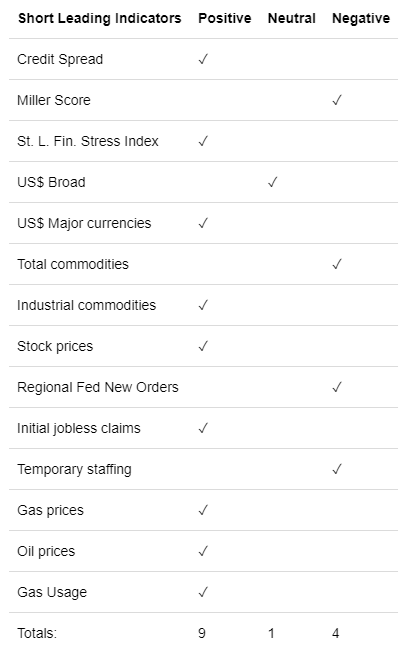
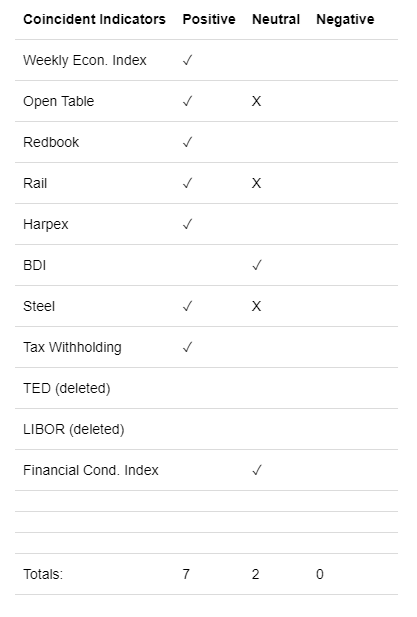
Short leading indicators remain solidly positive, and all coincident indicators are either neutral or positive, indicating a robust economic outlook.
Upcoming reports, including the jobs report and ISM surveys, will be crucial in assessing whether services continue to offset manufacturing weaknesses.” – NDD.
NDD NDD NDD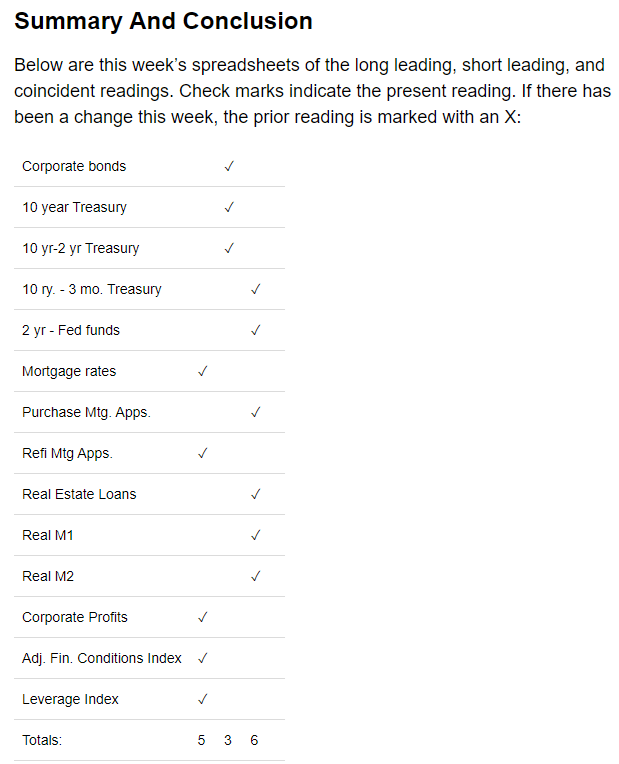
Cumulative Summary
Positive: 21
Neutral: 6
Negative: 10
Net (Positive + Neutral – Negative): +17
The economy is currently running at +17, indicating a strong overall economy, which agrees with the results of 9 other real-time indicators.
Last week, the economy was +16.
This confirms what the other models show: the economy has improved slightly over the last three weeks.
The economy is strong and accelerating, yet stocks are falling!
That means the market was highly overvalued, or the earnings outlook deteriorated. Let’s examine the data.
S&P Earnings & Valuation Outlook: The Strongest Reason To Remain Bullish On US Stocks
Daily Chartbook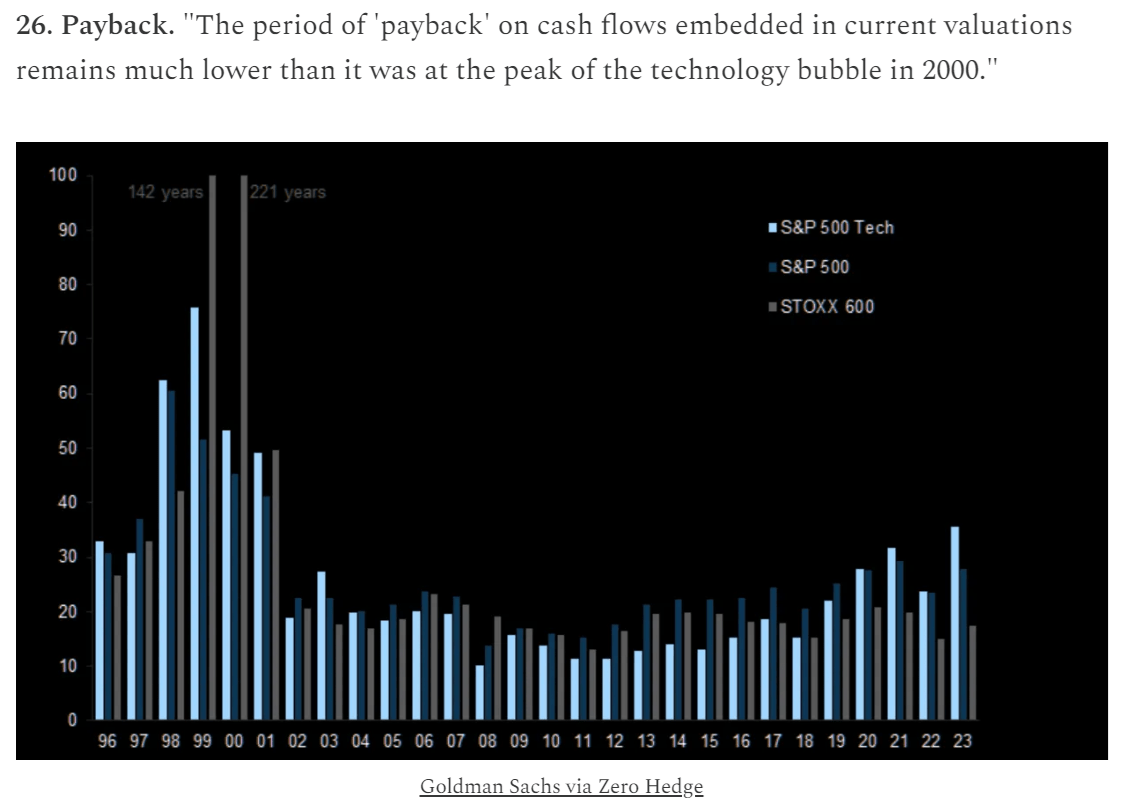
While US stock valuations are up, including a cash flow yield of 2.5%, compared to a tech bubble peak of 0.45%.
And keep in mind that today’s growth outlook for S&P profits is 2X better than historical norms of 6%.
- US cash flow multiples are 2X that of European stocks, but our growth is 2X better.
- On a growth-adjusted basis, US stocks are no more expensive than European.
In the short term (through 2026), European corporate profits are expected to grow by 8.0% CAGR.
- 3.6% CAGR since 2010 vs. 8.1% CAGR US stocks (2010 to 2023)
- 8.0% CAGR (2023 to 2026) for European Stocks vs. 12.8% CAGR (2023 to 2026).
Long-term average P/Es have been rising as big tech consistently grows faster than the S&P. Thus, more weighting for stocks tilts towards big tech.
Daily Chartbook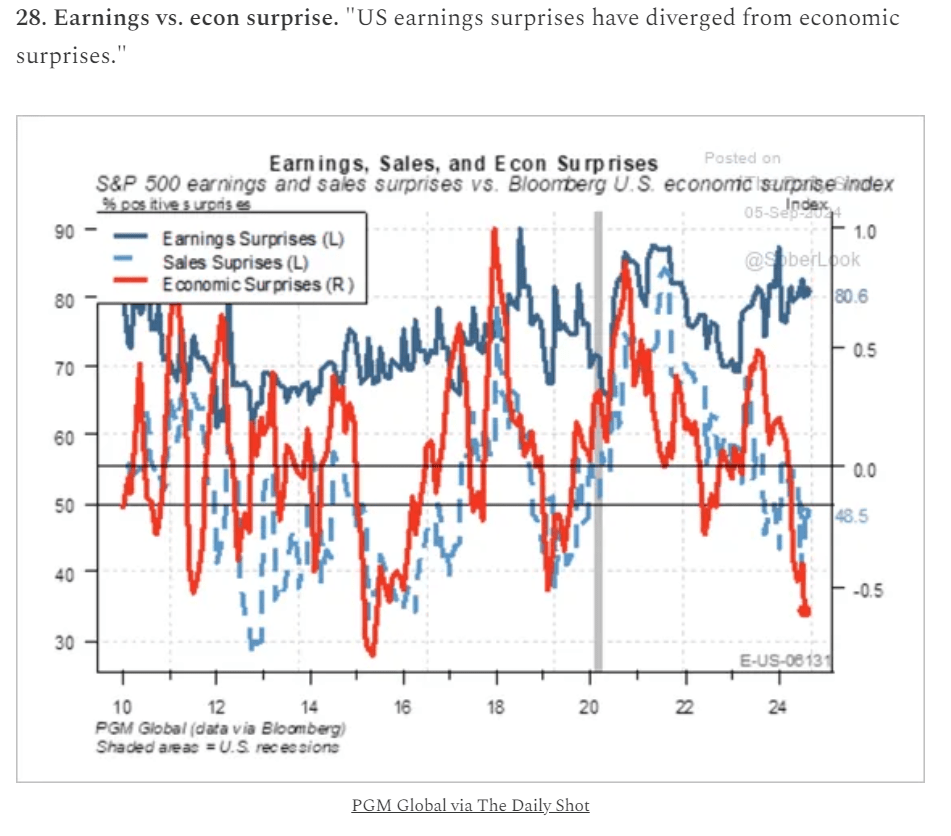
While economic data has been surprising to the downside, earnings have not been.
US companies slashed spending in 2022, preparing for a recession that never arrived.
Daily Chartbook Daily Chartbook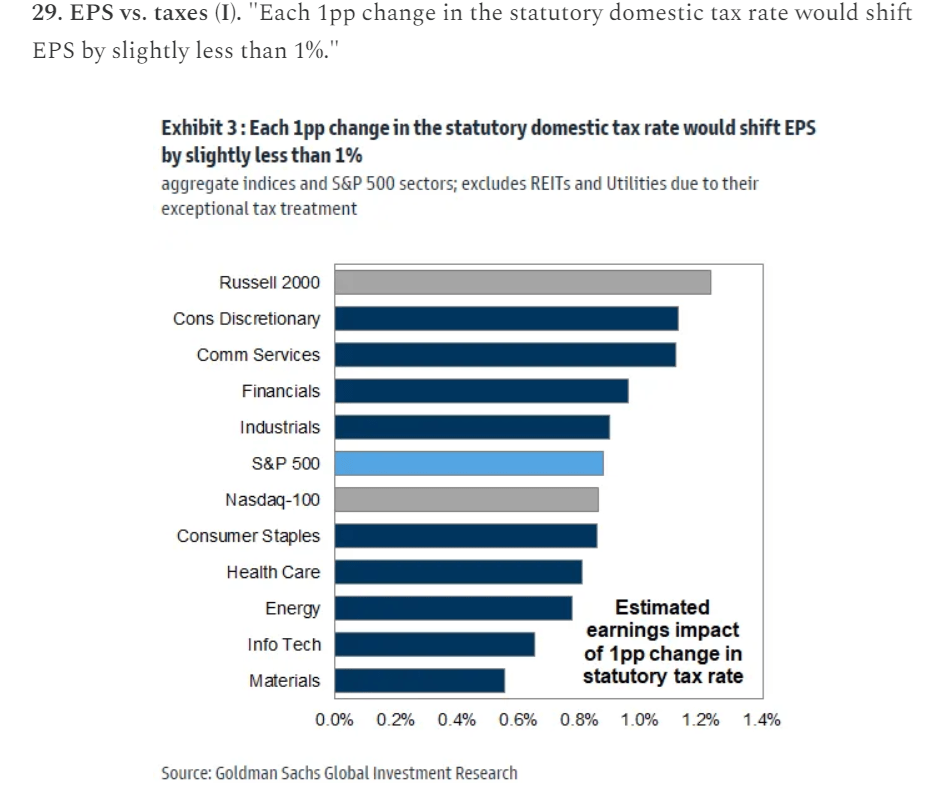
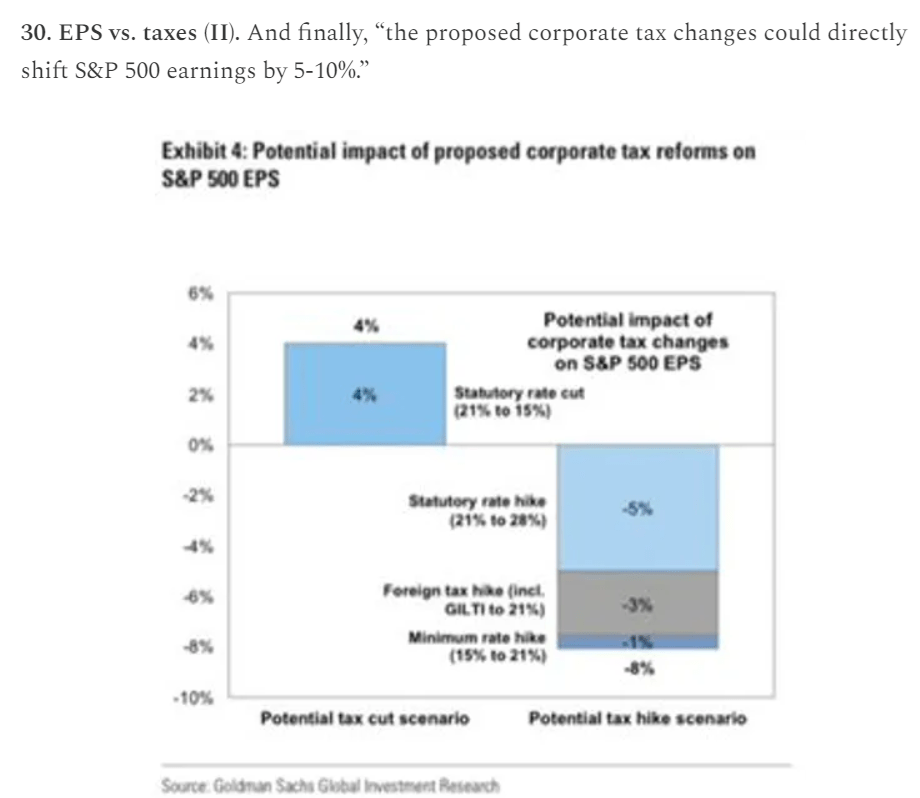
Assuming a red or blue wave provides Trump/Harris with a unified government, and both deliver their current tax proposals, Goldman estimates 2026 S&P EPS would be 4% higher with a 15% corporate tax rate or 8% lower under Harris’ proposals.
S&P Consensus Growth
FactSet Research Terminal 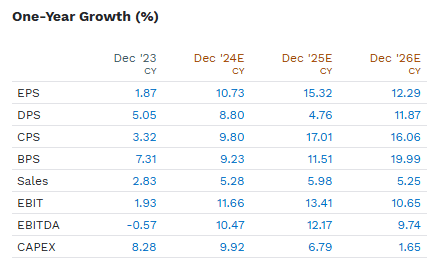
That would mean 4% to 16% EPS growth in 2026, assuming 100% control of the Presidency and Congress and enacting all proposed tax policies.
- The tax effects would last one year.
What is the probability of a divided government vs. a Red or Blue-wave?
Polymarket is the largest betting market, with over $1 billion in bets on the election. Polymarket estimates the probability of a Red sweep is 32%, a blue sweep 21%, and a 47% probability of divided government.
The State Of The Presidential Race (Tied)
| Date | Nate Silver | 538 | Decision Desk | Economist | Betting Markets Consensus | Harris Average |
Trump Average |
| 8/30/24 | 47.3% | 57.9% | 57.0% | 50.0% | 49.5% | 52.3% | 47.7% |
| 8/31/24 | 44.6% | 56.5% | 56.0% | 50.0% | 49.3% | 51.3% | 48.7% |
| 9/1/24 | 44.0% | 56.5% | 56.0% | 50.0% | 49.5% | 51.2% | 48.8% |
| 9/2/24 | 44.0% | 56.5% | 56.0% | 50.0% | 49.0% | 51.1% | 48.9% |
| 9/3/24 | 43.0% | 55.7% | 56.0% | 50.0% | 48.8% | 50.7% | 49.3% |
| 9/4/24 | 41.6% | 55.4% | 56.0% | 50.0% | 49.3% | 50.5% | 49.5% |
| 9/5/24 | 39.7% | 57.1% | 55.0% | 50.0% | 48.2% | 50.0% | 50.0% |
(Sources: Nate Silver, ABC, The Hill, Economist, Real Clear Politics.)
Even if there were a blue sweep, Senator Tester of Montana would serve the role of Joe Manchin/Kyrsten Sinema.
- Tester has vowed to vote against taxing capital gains.
- With a 50 Senate majority, Tester will limit any tax increases preventing progressives from getting everything they want.
A shortage of workers means that immigration or automation (or both) will be important to fueling US growth.
Rithotlz Wealth Management 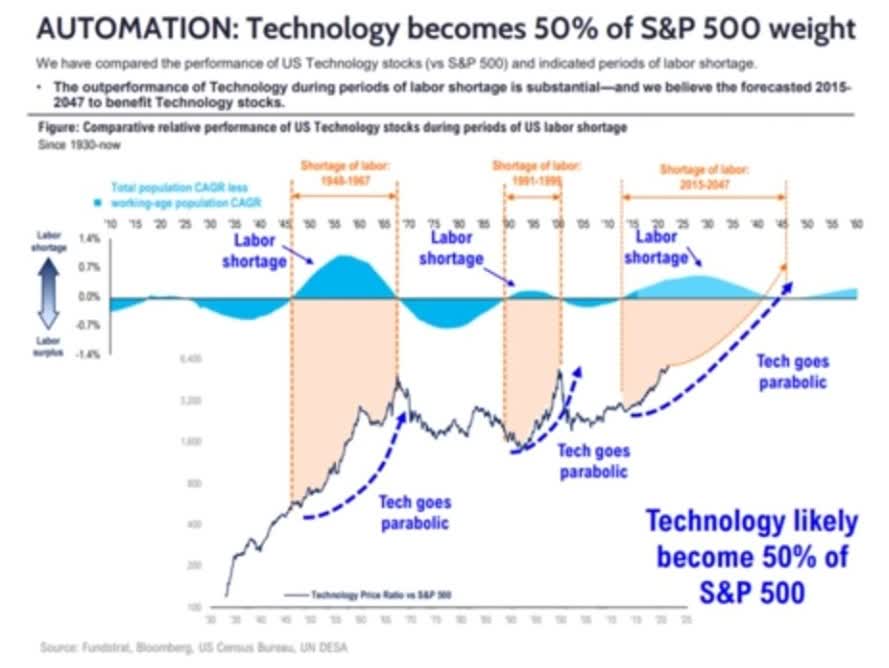
A global labor shortage has Fundstrat forecasting $3.5 trillion in annual spending on AI/Robotics.
Goldman Sachs agrees with Mr. Lee that if AI meets expectations, it could drive more substantial earnings growth (18% EPS growth base case) through increased productivity.
Goldman Expects AI To Start Boosting US Economy In 2027
Goldman Sachs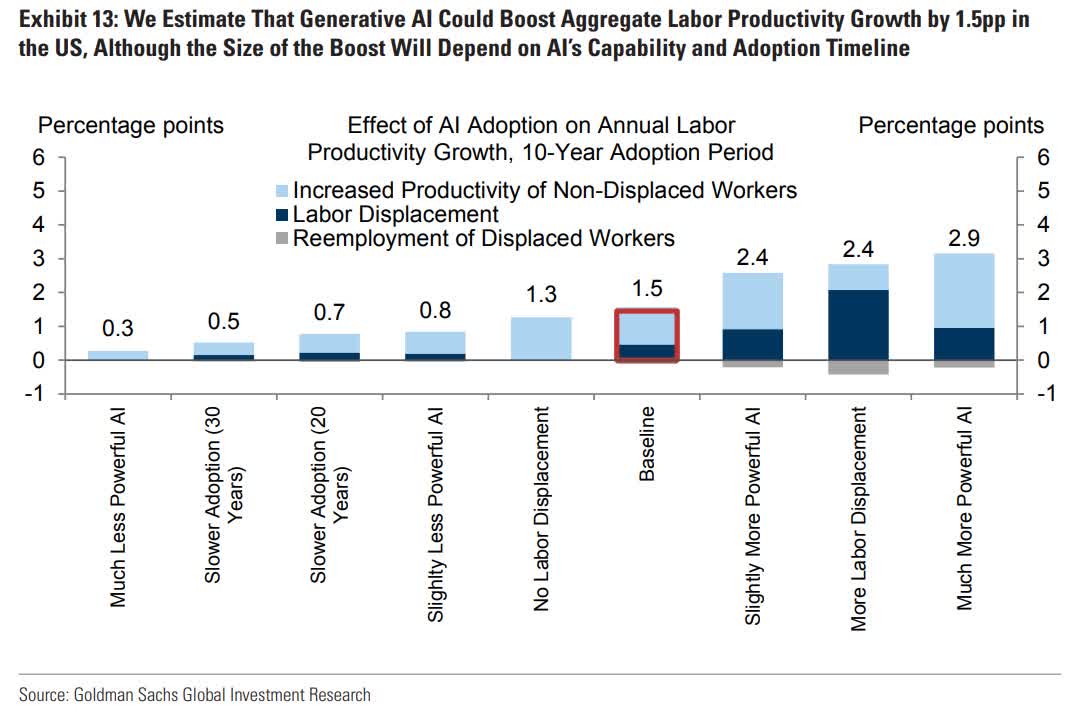
Goldman’s AI productivity boost range corresponds between 1.1% and 11% faster EPS growth.
- Morningstar/FactSet consensus 12% long-term EPS growth.
- 13.1% to 23% CAGR EPS growth due to AI.
- +1.3% dividend yield = 14.4% to 24.3% CAGR long-term S&P total return potential starting in 2027.
Goldman’s base case is 1.5% faster GDP growth, fueling 5.7% faster EPS growth.
- 17.7% EPS growth +1.3% dividend yield = 19% CAGR S&P total return potential from 2027 to 2037.
While these estimates and forecasts are far from guaranteed, anyone bullish on the future of technology should not be bearish on the stock market.
Meanwhile, the S&P’s PE is much higher than the 20-year average of 15.7, and the EPS growth rate of the last 20 years was 7%.
- 20-year Average Forward PEG ratio of 2.24.
- Today’s Forward PEG: 1.76.
And please keep in mind the Mag 7 have $1.2 trillion in cash on their balance sheets.
Net cash doesn’t count against a company’s valuation.
Motley Fool 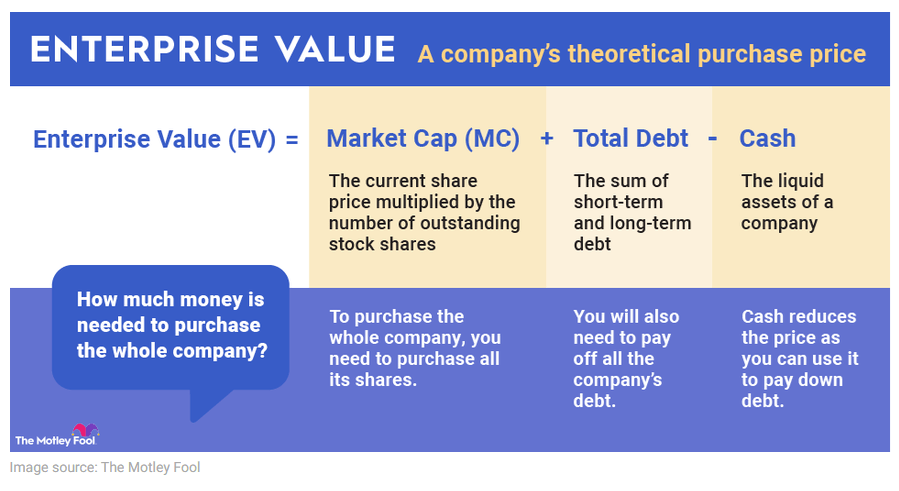
Enterprise value is the actual value of acquiring a company.
Daily Shot 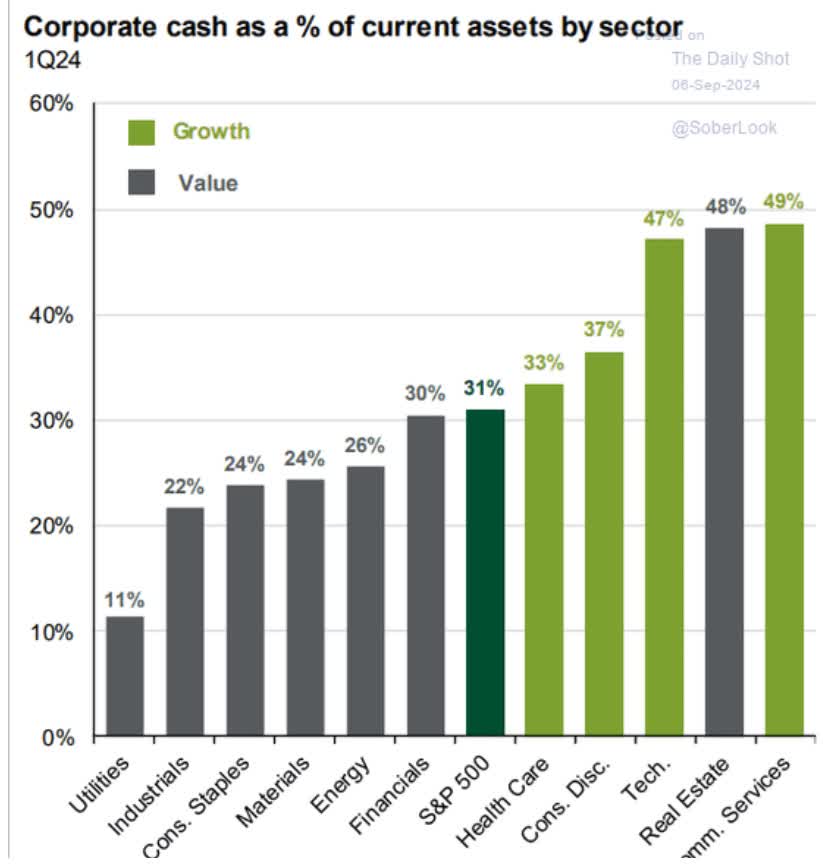
The faster tech grows vs. the rest of the S&P, the more of the S&P will be big tech.
And 50% of the balance sheet of big tech is cash.
That’s why a growing discrepancy exists between PE and EV/cash flow.
While US stocks are very expensive relative to foreign stocks, the 20-year average PE for foreign stocks is 13X.
Today, they trade at 13.4X, a slight premium.
In other words, foreign stocks should not trade at the exact multiples as US stocks; US companies are of higher quality (more profitable), have better management, and grow faster.
S&P Growth Consensus Profile
| Weekly Change In S&P EPS Consensus | Last Week’s EPS Consensus | Year | EPS Consensus | YOY Growth | Forward PE |
| 0.00% | $206.04 | 2021 | $206.04 | 50.03% | 26.3 |
| 0.00% | $214.33 | 2022 | $214.33 | 4.02% | 25.3 |
| 0.00% | $217.66 | 2023 | $217.66 | 1.55% | 24.9 |
| -0.09% | $241.23 | 2024 | $241.01 | 10.73% | 22.5 |
| -0.08% | $278.14 | 2025 | $277.93 | 15.32% | 19.5 |
| 0.04% | $311.96 | 2026 | $312.08 | 12.29% | 17.4 |
| 12-Month forward EPS | 12-Month Forward PE | Historical Overvaluation | |||
| $266.57 | 20.323 | 2.61% |
(Source: Dividend Kings S&P Valuation Tool.)
There are no indications of earnings expectations falling.
Earnings growth estimates are stable and robust.
Bottom-up EPS estimates are based on the median consensus of all company analysts.
And then weighted with the exact market cap weighting as the S&P.
FactSet reports that this bottom-up model has achieved 92% accuracy over the last 20 years.
- These represent the best growth estimates for 3,100 analysts covering the S&P 500.
S&P Valuation Profile
| Week | 36 | |
| % Of Year Done | 2024 Weighting | 2025 Weighting |
| 69.23% | 30.77% | 69.23% |
| Forward S&P EV/EBITDA (Cash-Adjusted Earnings) | 10-Year Rolling Average | Market Overvaluation |
| 13.89 | 13.54 | 2.61% |
| S&P Fair Value | Decline To Fair Value | Fair Value PE |
| 5,275.40 | 2.55% | 19.82 |
(Source: Dividend Kings S&P Valuation Tool.)
The S&P appears to be 2.6% overvalued if you compare its current forward EV/EBITDA (cash-adjusted earnings) to its 10-year rolling average.
S&P Cash-Adjusted Growth Profile
| Potential Overvaluation (10-Year Average) | S&P 10-Year Average Cash-Adjusted PEG | S&P Current Cash-Adjusted PEG |
| -35.38% | 1.77 | 1.14 |
| Potential Overvaluation (25-Year Average) | S&P 20-Year Average |
S&P Current Cash-Adjusted PEG |
| -52.74% | 2.42 | 1.14 |
| PEG Adjusted Overvaluation | Immediate Justified Upside Potential | Potential 12-Month Fundamentals Justified Returns |
| -14.74% | 11.73% | 25.19% |
(Source: Dividend Kings S&P Valuation Tool.)
Morningstar now estimates a 12.13% long-term EPS growth consensus on the S&P, similar to what FactSet shows.
The long-term growth outlook for the S&P is going up while valuations are coming down.
If the growth outlook remains constant over the next 12 months and corporations deliver on their expected growth, a 25% rally in the S&P would bring the cash-adjusted PEG to 1.42 (acceleration growth adjusted fair value).
In other words, based on how PEG ratios have changed over the last 25 years when profit growth has accelerated, I estimate the S&P’s fair value cash-adjusted PEG would settle around 1.42.
Thus, if today’s trends hold for the next year and the S&P is up 25%, then the move would be justified by fundamentals.
S&P Correction Watch
| All-Time High | $5,669.67 |
| Current | $5,411.58 |
| Distance From High | 4.55% |
| Pullback Level | 5386.19 |
| Correction Level | 5102.70 |
| -15% Correction Level (Historically Average Correction Bottom) | 4819.22 |
| Bear Market Level (-20%) | 4535.74 |
| -25% Bear Market | 4252.25 |
| -30% Bear Market | 3968.77 |
| -35% Bear Market | 3685.29 |
| -40% Bear Market | 3401.80 |
| Distance To Pullback | 0.4% |
| Distance To Correction | 5.4% |
| Distance To 15% Correction (Average Intra-year Peak decline) | 10.9% |
| Distance To Bear Market | 16.18% |
| Distance To -25% Bear Market | 21.4% |
| Distance To -30% Bear Market | 26.7% |
| Distance To -35% Bear Market (Average Historical Recessionary Bear Market Low -36%) | 31.9% |
| Distance To -40% Bear Market | 37.1% |
| Record Closes This Year | 38 |
| Most Record Closes Ever (1995) | 77 |
| On Track For Record Closes: | 54.9 |
(Source: Dividend Kings S&P Valuation Tool.)
The S&P is now 5.4% away from a correction, down 4.6% from its record highs.
The pullback remains in effect, achieving a 9.7% peak decline on August 5th.
Charlie Bilello 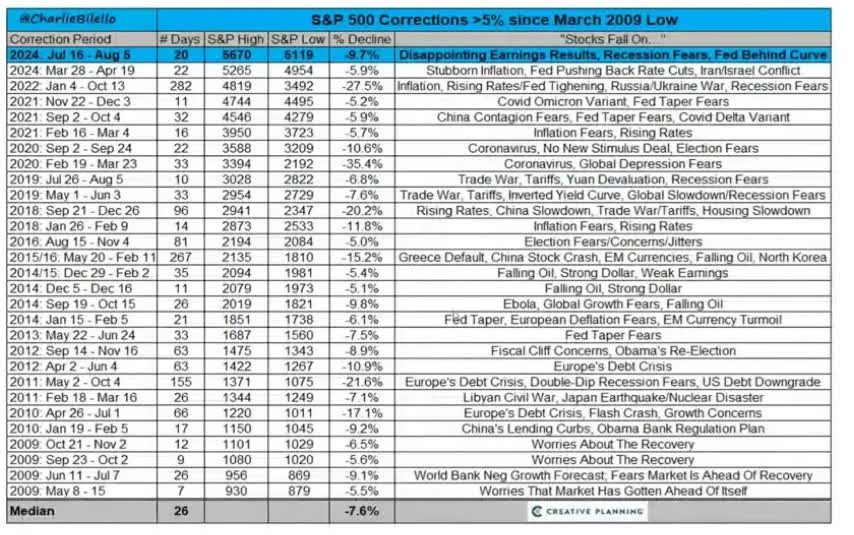
This isn’t a correction yet, but if it becomes one, buy with confidence, knowing that the economic and earnings fundamentals are strong, stable, or even improving.
Bottom Line: The Economy Is Still Strong, And Corporate Profit Growth Outlook Is Very Bullish
I can’t predict what the market will do in the short term, but the economic and corporate profits fundamentals look very strong.
The job market has cooled, but is currently not at risk of tipping consumer spending negatively.
Consumer spending has been accelerating recently, and falling interest rates and higher government spending next year will likely create further tailwinds for strong economic growth in 2025 and beyond.
If anyone tells you “the stock market is in a bubble and about to crash,” they are not basing that on facts but on cherry-picked stats, outright lies, or ignorance.
In other words, doomsday prophets are either ignorant, lying, or trying to sell you something, sometimes all three.