Daniel Grizelj/DigitalVision via Getty Images
The Federal Reserve has as one of its main tools to manage the rate of inflation the Federal Funds Rate. The purpose of this tool is to either entice borrowers to borrow if they make the interest rate low, or to reduce demand for borrowers if they make the cost of money high. When the Fed is trying to lower inflation, the end goal is to reduce the rate of growth in the aggregate amount of debt outstanding. Since we have a debt based money system, inflation that comes from monetary growth is simply the rate of growth in aggregate debt per capita.
There is critical check and balance on this tool and that is the interest expense that comes with higher interest rates. As the Fed raises rates to reduce inflation toward their goal of 2%, the overall economy is going to be dealing with substantially higher interest expenses.
Prime Rate Vs. Fed Funds Rate
To illustrate this check and balance, I like to use the Prime Rate, which is the rate that banks will tend to charge their best customers. Today it stands at 8.5%. The Fed Funds rate is at 5.33%.
Below is a chart of these two rates going back to 1955:
Prime Rate Vs Fed Funds Rate (St. Louis Fed FRED)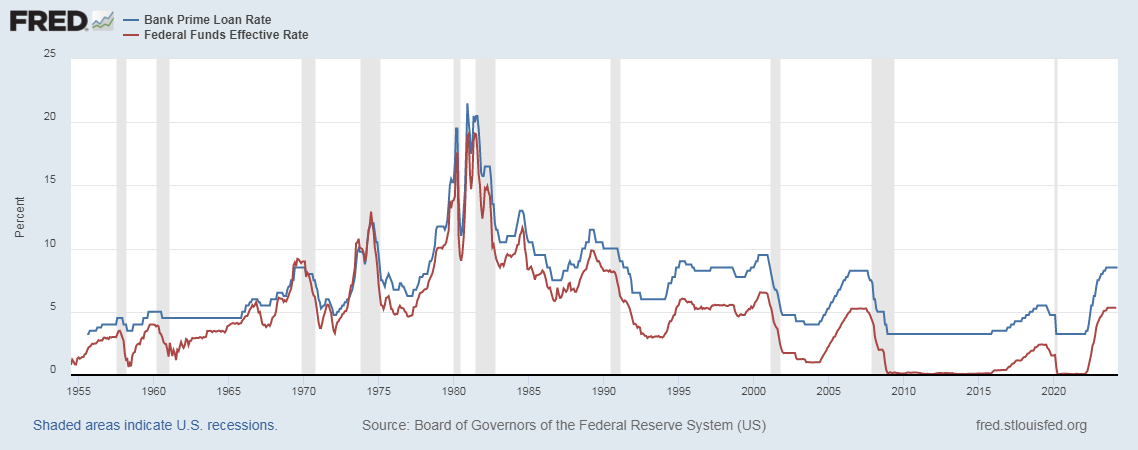
Debt
As of the 4th quarter of 2023, the US economy has $98.37 Trillion dollars in aggregate debt outstanding. This includes personal debt, business debt and Government debt combined. Below is a chart of this aggregate debt figure:
Total Debt (St. Louis Fed FRED)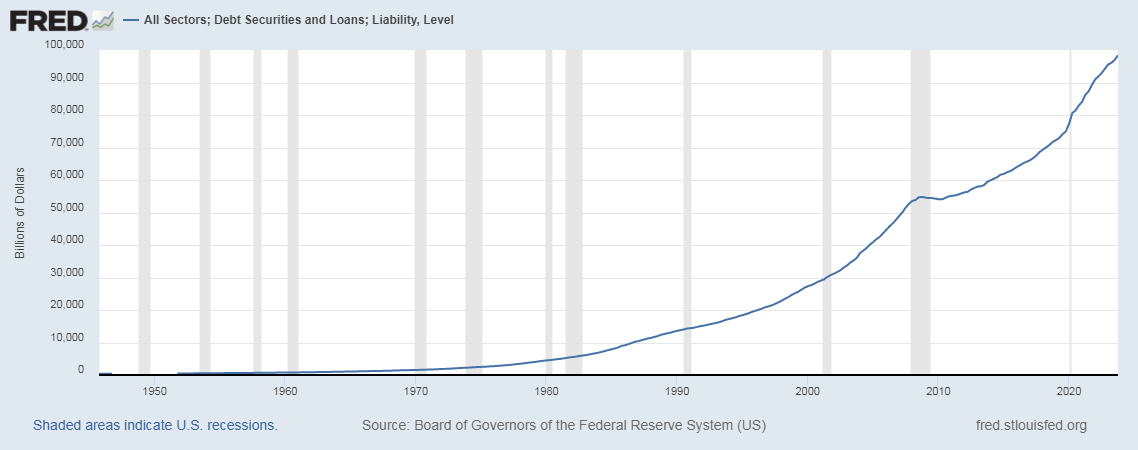
US Economy – GDP
US GDP as of the 4th quarter of 2023 was $27.957 Trillion dollars.
US GDP (St. Louis Fed FRED)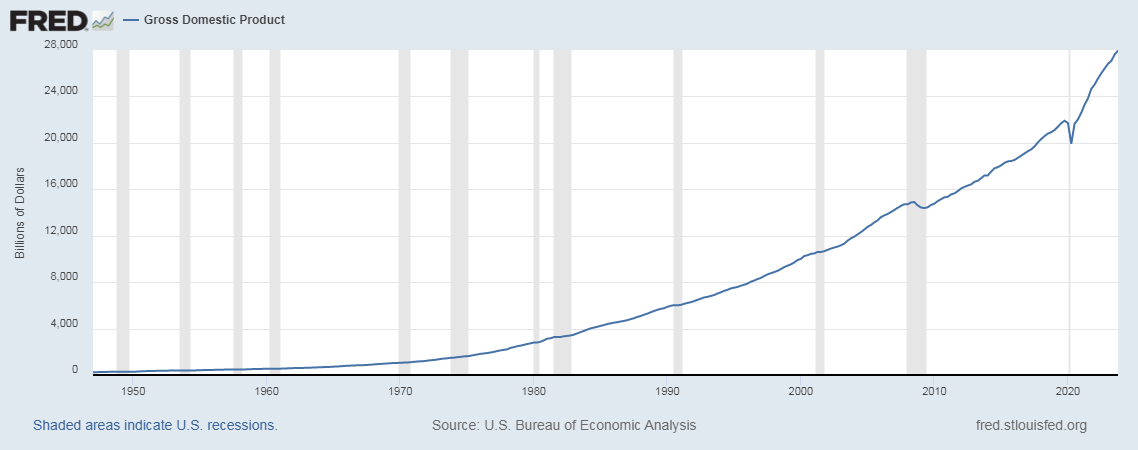
We have an economy with a GDP of $27.957 Trillion and an aggregate debt level of $98.37 Trillion making the debt to GDP ratio about 3.5x.
The historical ratio of Debt to GDP looks like this:
Debt to GDP Ratio (St. Louis Fed FRED)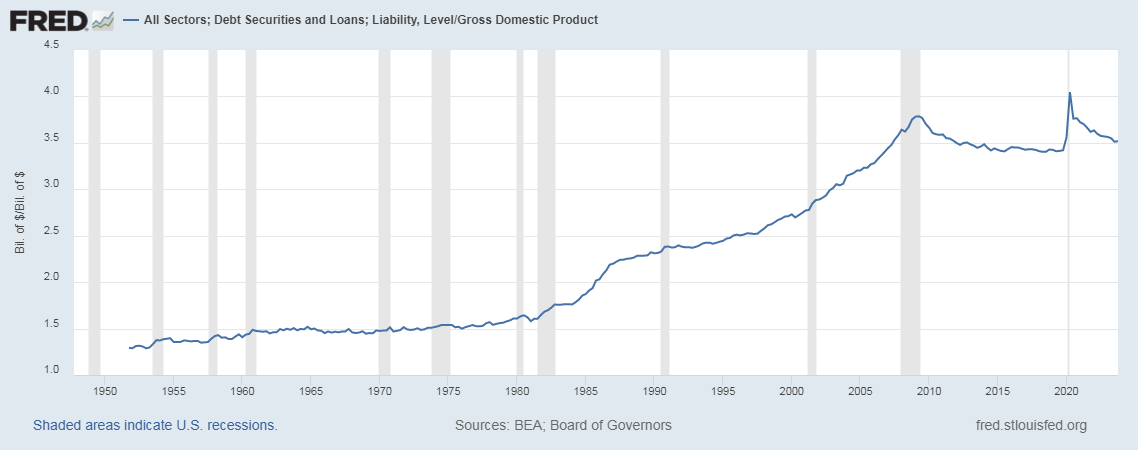
Prime Rate To Debt To GDP
Simply as an exercise, it’s good to get an idea of how much Prime Rate cost of money interest expense would compare as a percent of GDP.
What I’m going to do is apply the Prime Rate to the overall debt outstanding to get an overall interest expense as if the entire outstanding debt were lent at the Prime Rate. Then I’ll see what that expense is as a percent of GDP.
Prime Rate To Debt To GDP (St. Louis Fed FRED)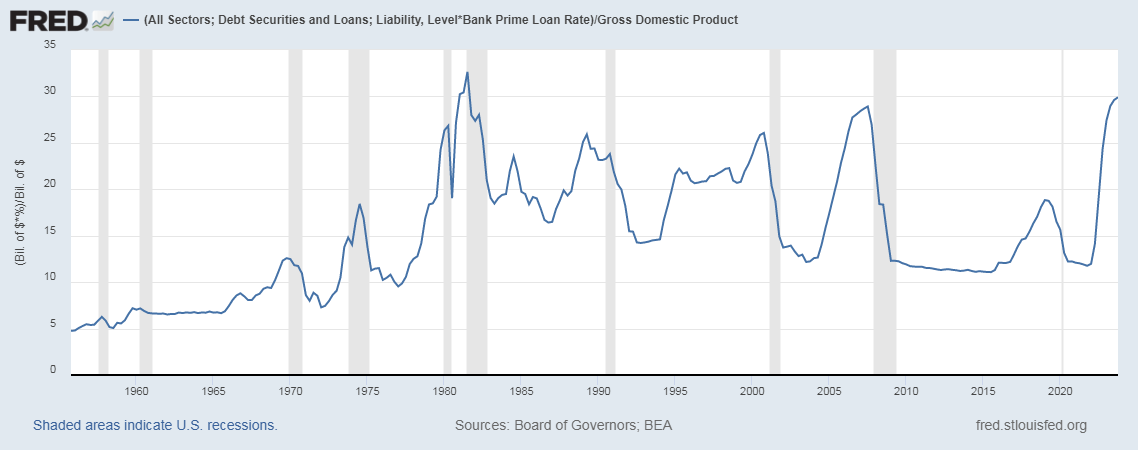
In the 4th quarter of 2023, per this exercise, a hypothetical interest expense at the Prime Rate of 8.5% with $98.37 Trillion dollars outstanding would be $8.242 Trillion dollars. That comes out to about 29.9% of GDP.
What gives justice to this exercise is that historically, using these very same metrics, we’ve only been at this level once and that was in the 3rd quarter of 1981, when it would reach 32.65%.
What’s also noteworthy is that every time this metric would spike like this, the Fed Funds Rate would come crashing down soon after.
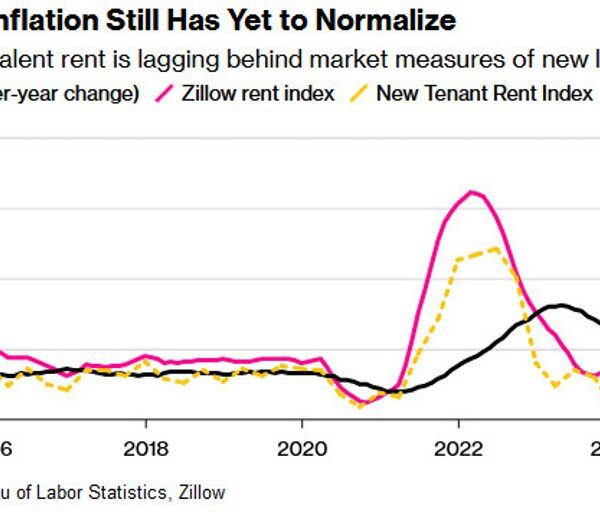
Inflation
Inflation is running at a year over year rate as of March at 3.48%, well above the goal of 2%.
Here is a long term chart the rate of inflation:
Inflation (St. Louis Fed FRED)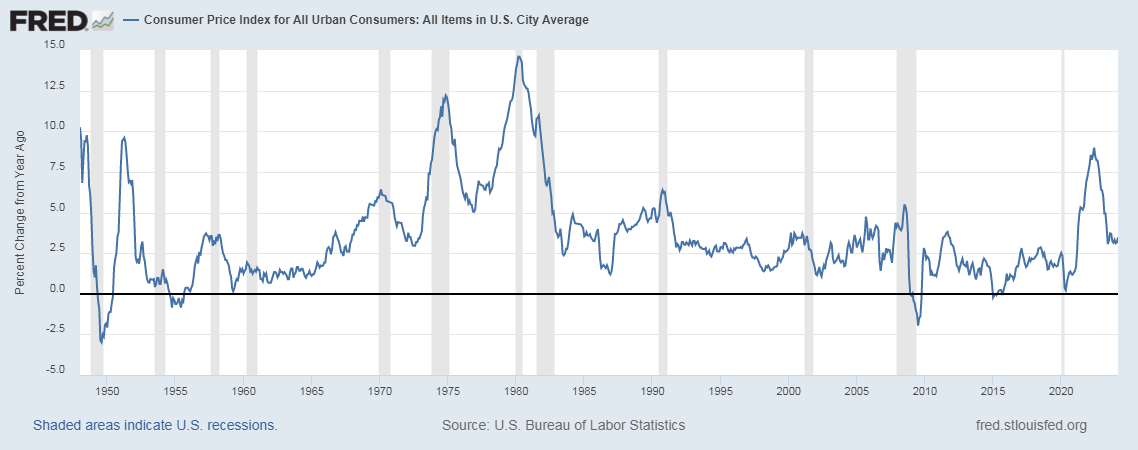
After recently peaking in June of 2022 at a rate of nearly 9%, inflation began to tumble until around the summer of 2023 where it has been bouncing around the 3.0% – 3.5% range since. This is of concern to the Fed as they would have hoped to have already achieved their inflation target of 2% by now.
Productivity – The Cost Sheet
Inflation has 2 components that’ll impact what it’ll be:
1. Aggregate debt growth per capita
2. Input costs or the cost sheet
Way too much attention is put on the Fed to control inflation. Too little attention is drawn to the cost sheet of every facet of the US economy.
A tremendous driver of lowers costs comes from productivity, which comes from improving the cost sheet.
There have been many great improvements in reducing the cost sheet over the past 5 years now. For example, many workers now telecommute and that helps reduce transportation costs, improving the cost sheet for a person to go to work. Another example is improvements being had with AI for white collar work.
At the same time, wars and a substantial inflow of migrant asylum seekers that have been added to the Government dole have simply been a major input cost and these are costs that don’t necessarily improve the cost sheet and can be inflationary forces. Higher interest rates also make for higher interest expenses and that too adds to the cost sheet of goods and services that are purchased with borrowed money.
Conclusion
The Fed has been very successful in reducing the rate of inflation from its highs in 2022. However, the 2% mark seems to be out of reach. There is only so much more time before they will be forced to cut rates again as the longer rates are kept high, the more unintended economic damage could be done.
The geopolitical environment continues to grow more uncertain and wars have always been major inflationary forces.
Inflation will continue to come from an input cost crisis and the Fed is far more powerless on having any impact on that.
Have low expectations for inflation to come down to 2%. The Fed will be far more likely to have to cut rates before their inflation target of 2% is met. I expect rate cuts during the 2nd half of 2024.
The best hope for lower inflation is better management of the cost sheet from every American business, every American household and every American house of Government.