
Prediction score: -4 on a -10 to +10 scale
Bias: Bearish below $90.00, with stronger confirmation if WTI remains beneath the $89.93-$90.13 decision zone
WTI crude oil futures have shifted toward a short-term bearish setup after briefly trading above the previous session’s $91.31 value-area high and then reversing through several important price references. I currently favor sellers below $90.00, but the compressed $89.93-$90.13 zone may produce noise before the next clearer move.
Key takeaways for crude oil traders today
- Bearish activation: Below $90.00, ideally followed by sustained trade under $89.93.
- Immediate decision zone: $89.93-$90.13, where the developing VWAP, developing point of control and previous session’s lower value boundary are tightly grouped.
- Staged short entries: $90.00, $90.11 and $90.45, treated as one bearish position idea rather than three separate trades.
- Bearish invalidation: A sustained reclaim above $90.90, with a protective stop buffer near $90.94.
- Main bearish targets: $89.58, $88.67, $88.09, $87.27 and $86.33.
The -4 score indicates a meaningful bearish edge, but not an extreme one. It is a snapshot of current conditions, not a guarantee that WTI will continue lower or reach every target.
I’m closely monitoring the escalating geopolitical landscape and its immediate impact on energy market microstructure, particularly after the WSJ reported that Trump is privately weighing declaring war on Iran to keep strategic options open.
We are seeing immediate, aggressive order-flow reactions, and as Adam from investingLive.com pointed out, crude oil is popping higher following alarming reports out of Kuwait regarding incoming missile and drone attacks.
The supply chain anxiety is driving significant volume delta and pushing price action above key structural levels, a situation further amplified by Yam’s recent breakdown detailing how the US military is now actively escorting 40 tankers carrying 18 million barrels safely through the Strait of Hormuz.
Away from the commodities desk, the broader macro structure is also shifting; Greg at investingLive.com notes that bond yields are pulling back from their recent highs, drifting below their daily VWAP as traders digest the flight-to-safety bid and pivot focus toward the upcoming US jobs report.
What happened to WTI crude oil overnight?
Using UTC-4 chart time, WTI traded near $91.50 during the September 2 overnight session and briefly crossed above the previous session’s value-area high near $91.31. Buyers could not sustain the breakout.
Price then reversed through several important references:
- The developing VWAP, previously near $90.70
- The previous session’s point of control near $90.75
- The previous session’s VWAP near $90.48
- The previous session’s value-area low near $89.93
That sequence matters more than the initial move above $91.31. WTI went from attempting acceptance above the prior value area to trading beneath most of the prices where the previous session had established value.
What this means: A value area represents the price region where most trading activity occurred during a session. When price moves above that region and then quickly falls through it, the failed breakout can show that buyers were unable to establish control at higher prices.
The reversal also leaves a possible lower high near $91.46, compared with the recent peak near $92.28. In my view, the failed breakout, lower-high risk and downward move through multiple value references give sellers the stronger short-term case.
Why is $89.93-$90.13 the main crude oil decision zone?
WTI is not breaking from one isolated level. Three references are compressed into a narrow range:
Developing VWAP: approximately $90.13
This is the session’s volume-weighted average price. Trading beneath it suggests that current buyers are struggling to regain the session’s average traded value.
Developing point of control: approximately $89.95
This is the price around which the session has generated the most volume so far. Price can rotate around it before a clearer directional move develops.
Previous session’s value-area low: approximately $89.93
This marks the lower edge of the prior session’s main accepted-value region. Sustained trade below it would strengthen the bearish case.
The cluster makes $89.93-$90.13 an immediate decision zone rather than a perfectly clean breakdown line. Short-term price may move back and forth around this area. That is why I would give more weight to sustained trade below $89.93 than to a brief dip under $90.00.
What is the bearish WTI crude oil trade scenario?
The bearish scenario activates below approximately $90.00, with better confirmation if WTI remains below $89.93.
Rather than depending on one exact fill, I am considering three staged short entries:
- $90.00, near the current price and developing point of control
- $90.11, just beneath the developing VWAP
- $90.45, just below the previous session’s VWAP near $90.48
The third entry has a lower probability of being filled. If WTI retraces that far without repairing the bearish structure, however, it could improve the average entry and provide more room before invalidation.
These entries belong to one bearish trade idea. They are not three invitations to keep re-entering the same direction. If an initial bearish trade is completed, whether at a target, breakeven or the stop, the tradeCompass principle is to avoid taking another short from the same published map.
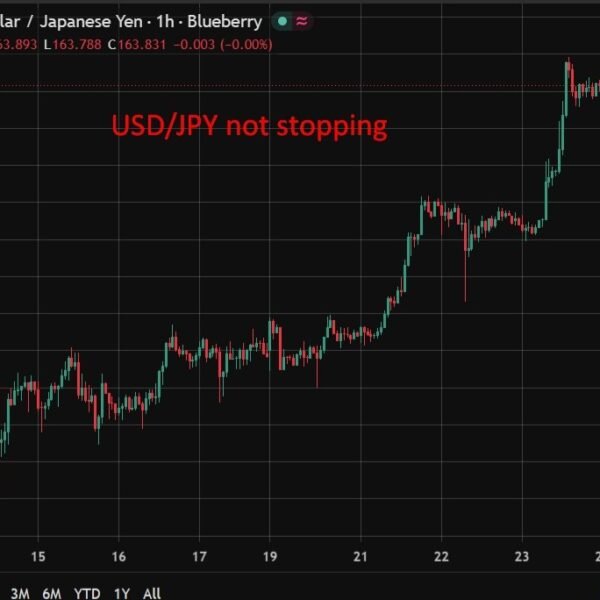
As I show on my chart below, crude oil has aggressively broken out above its descending pitchfork channel, pushing past the $90 mark. In technical analysis, former resistance levels often flip into support, meaning price could pull back toward the $87 zone to retest the broken boundary. Watching how price reacts if it revisits that upper trendline will signal whether buyers defend the breakout or sellers regain control.
What would invalidate the bearish crude oil setup?
A sustained reclaim above $90.90 would weaken or invalidate the bearish thesis. My protective stop buffer is near $90.94.
This gives the position some room above the previous session’s point of control and nearby breakdown structure, but it is not a tight stop. Position size should be based on the full distance from the actual average fill to $90.94.
Traders should not continue adding to the bearish position if WTI is accepting above $90.90. A stop exists to define where the trade idea is wrong, not as a level to widen after price moves against the position.
What are the bearish crude oil targets?
If WTI remains below the decision zone and sellers maintain control, the bearish partial-profit targets are:
- $89.58
- $88.67
- $88.09
- $87.27
- $86.33
The first target at $89.58 sits just above the September 1 value-area high. I view it as a defensive first partial, not the target expected to deliver the full reward-to-risk potential.
The second target at $88.67 is positioned above the September 1 VWAP. The third at $88.09 sits above both the $88 round number and the September 1 point of control, allowing for a possible reaction before those obvious references.
The $87.27 area may become a downside magnet, but it could also attract short covering and produce a sharper bounce. The final target at $86.33 offers the strongest overall reward-to-risk potential if the decline expands into a larger swing.
How does the reward-to-risk profile change at each target?
If all three short entries are filled equally, the average entry would be approximately $90.19. With the stop at $90.94, the indicative reward-to-risk profile would be:
WTI bearish targets and reward-to-risk
First target: $89.58
Approximate reward-to-risk: 0.8R
Second target: $88.67
Approximate reward-to-risk: 2.0R
Third target: $88.09
Approximate reward-to-risk: 2.8R
Fourth target: $87.27
Approximate reward-to-risk: 3.9R
Final target: $86.33
Approximate reward-to-risk: 5.1R
These figures are estimates. Actual results depend on which orders are filled, the position size assigned to each entry, slippage, commissions and where profits are taken.
If only the first entry fills, the position will be smaller and the average price less favorable. The benefit is that WTI may already be moving toward the targets, reducing exposure to a deeper retracement.
How could the bearish trade be managed after the first target?
If WTI reaches $89.58, traders can consider taking the first partial profit and moving the stop toward the average entry. Another option is to reduce the stop toward approximately $90.35, depending on subsequent price behavior and the trader’s own execution plan.
After the second target at $88.67, the remaining risk should generally be reduced further. The aim is straightforward: once the market has paid the first or second partial target, the remaining position should not casually return to its original full-sized risk.
Moving a stop to entry can reduce risk, but it cannot eliminate slippage or execution risk during fast market conditions.
What would make WTI crude oil bullish again?
The bullish tradeCompass scenario activates above $90.90. A brief touch is not enough by itself. Buyers would ideally need to hold the reclaim or successfully defend the level on a retest because this area overlaps the recent breakdown structure.
If WTI accepts above $90.90, the bullish partial-profit targets are:
- $91.14
- $91.28
- $91.80
- $92.46
The first target is close, but a previous VWAP standard-deviation reference sits nearby. The second target at $91.28 is positioned just beneath the prior value-area high near $91.31.
Above that area, $91.80 becomes the next upside objective. The final target at $92.46 would become relevant only if buyers fully repair the failed breakout and regain control.
WTI crude oil levels to watch today
Bullish activation and bearish invalidation: Above $90.90
A sustained reclaim would suggest buyers are repairing the breakdown. The bearish stop buffer is near $90.94.
Higher staged short entry: $90.45
This sits just beneath the previous session’s VWAP and may provide a better bearish entry if WTI retraces without regaining bullish acceptance.
Immediate decision zone: $89.93-$90.13
The developing VWAP, developing point of control and previous session’s value-area low are clustered here.
Bearish activation: Below $90.00
The signal becomes more convincing if WTI also holds below $89.93.
First defensive bearish target: $89.58
This is the first area to consider reducing risk rather than the main reward objective.
Main downside target region: $88.67-$88.09
This zone contains the second and third partial-profit objectives and may produce a reaction.
Deeper swing target: $87.27
This level may attract price, but it could also trigger short covering.
Final bearish target: $86.33
This becomes relevant if the intraday reversal develops into a broader downside swing.
Could crude oil remain inside a wider range?
Yes. WTI may still be trading inside a broader range of approximately $89.50-$91.50. The rejection above $91.31, the possible lower high beneath $92.28 and the break through the previous session’s value references currently tilt that range toward sellers.
The bearish view weakens if WTI repairs the breakdown and accepts above $90.90. Until then, rallies toward VWAP-related resistance may provide better short locations than chasing price after an extended drop.
How can oil traders and equity traders use this map?
The tradeCompass allows a maximum of one completed trade per direction. Bearish targets become relevant only after the bearish scenario activates, while bullish targets become relevant only after price confirms above the bullish threshold.
The map may also provide cross-asset context for equity traders. Falling oil can ease concerns about energy costs and inflation, potentially supporting some stocks. If equities rise while WTI approaches $87.27 or $86.33, those oil levels may be useful checkpoints for protecting equity gains or reassessing whether the cross-asset move has become extended.
The reason for the oil decline still matters. Oil falling because inflation pressure is easing can be constructive for equities. Oil falling because markets expect weaker economic demand may instead be a warning about growth. Crude should therefore be treated as one cross-asset clue, not as a standalone equity signal.
How to know if this crude oil analysis is still valid
This map is most useful while WTI is still reacting around the published levels. If price has already moved far below the first targets, the article should not be treated as a fresh short entry signal. Use the targets to manage an existing position or assess whether the move is becoming extended.
If WTI has reclaimed and accepted above $90.90, the bearish setup is no longer the active scenario. A newer tradeCompass should take priority if market structure changes materially after publication.
For more context on threshold activation, confirmation, partial profits and the one-trade-per-direction principle, read the investingLive guide to using a tradeCompass market map.
The prices in this analysis refer to WTI crude oil futures. Oil CFDs, energy ETFs and other related products may trade at different prices, so traders should adapt the map to the instrument they actually use.
tradeCompass is an orientation and risk-management map, not a promise that price will reach every target. Trade at your own risk and return to investingLive.com for additional market perspectives.