FUNDAMENTAL
OVERVIEW
Silver erased most of its monthly gains in the final part of last week as
real yields surged and we got broad risk-off flows heading into the weekend
risk after some hawkish Trump’s remarks on Iran. The divergence with gold we’ve
seen in the past couple of weeks has been now corrected.
Overall, the fundamentals haven’t changed at all. The main problem for silver
and gold remains the Fed. Although the central bank is still keeping an easing
bias, we are now approaching a point where the Fed is likely to drop it
entirely. The market is now pricing in a 50% chance of a rate hike by year-end.
If nothing changes before the June meeting, we might be in for a hawkish
surprise as inflation continues to run hot and the US data remains resilient. In
such a case, silver will likely break the March lows.
In the short-term, a resolution and the reopening of the Strait will likely
support silver on falling oil prices and increased rate cut bets. But if the
Strait remains closed for longer and oil prices stay elevated, the risk of the
Fed turning hawkish anyway increases.
SILVER TECHNICAL
ANALYSIS – DAILY TIMEFRAME
Silver – daily
On the daily chart, we can
see that silver erased most of its monthly gains. From a risk management
perspective, the buyers will have a better risk to reward setup around the
major upward trendline to position for a rally into the 96.00 level. The
sellers, on the other hand, will look for a break lower to increase the bearish
bets into the next major trendline around the 60.00 handle.
SILVER TECHNICAL ANALYSIS –
4 HOUR TIMEFRAME
Silver – 4 hour
On the 4 hour chart, we can
see the bearish momentum increased as the price broke below the minor upward
trendline and then the support as more sellers piled in. There’s not much we
can glean from this timeframe as we don’t have clear levels where to lean on
except the major trendline around the 70.00 handle.
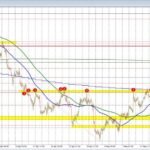
SILVER TECHNICAL ANALYSIS –
1 HOUR TIMEFRAME
Silver – 1 hour
On the 1 hour chart, we have
a minor counter-trendline defining the current pullback. Aggressive buyers will
likely lean on the trendline with a defined risk below it to keep pushing into
the 83.00 resistance. The sellers, on the other hand, will want to see the price
breaking lower to increase the bearish bets into the 70.00 handle next. The red
lines define the average daily range for today.
UPCOMING CATALYSTS
On Wednesday,
we have the FOMC meeting minutes. On Thursday, we get the latest US Jobless
Claims figures and the US Flash PMIs.