Amazon stock technical analysis shows the previous failed breakout but puts AMZN back at a key weekly support after a 19% correction from the all-time-high
Amazon’s weekly chart is sending a clear message: the recent push to new highs did not hold. The all time high was reached on 04 May, 2026, which is 40 trading days ago, and 56 days ago. Last week reached a low that is just over 19% lower. Many would consider that as a ‘correction’ although those definitions are more opinions than science.
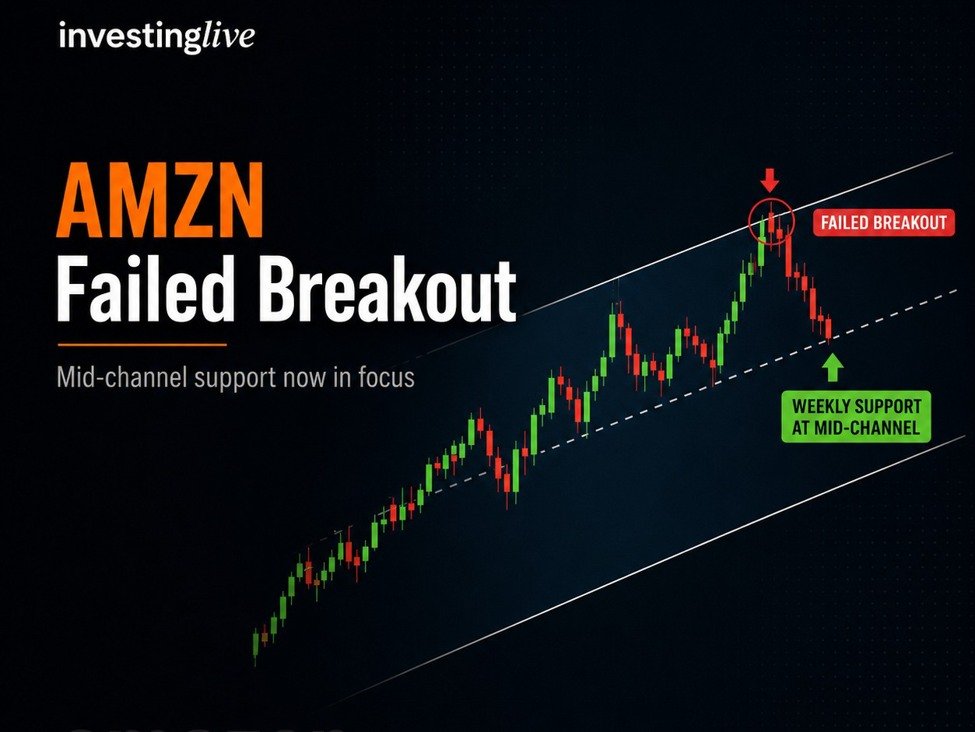
Amazon stock weekly chart at investingLive.com
AMZN rallied sharply into late April and early May, reached a new high near $278.56, and briefly looked like it was breaking out above its long-term rising channel. But instead of building above that level, the stock quickly reversed back inside the channel.
That is usually not a healthy sign. When price breaks above a major channel and then falls back inside it, traders often call that a failed breakout or a bull trap.
The question now is simple: does Amazon hold the middle of the channel, or does the failed breakout open the door for a deeper pullback?
The weekly channel is still the main guide
The chart shows a large rising channel that has guided AMZN for many months.
The lower boundary has acted as a longer-term value area, where buyers previously stepped in near the $150-$160 region. The upper boundary has acted more like a profit-taking zone, where rallies have struggled to continue.
The dashed line in the middle of the channel is also important. It has acted as a swing area before, sometimes as support and sometimes as resistance. AMZN is now trading very close to that mid-channel line again.
That makes the current area important. It is not just a random pullback. Price is testing a key part of the weekly structure.
For traders, the lesson is straightforward: buying near the top of a long-term channel usually offers poor risk-reward. Buying near the middle or lower part of the channel gives more room for error.
Why the failed breakout matters
The move above the channel looked strong at first. That is exactly why it can trap traders.
Breakout buyers often jump in when a stock makes new highs. Short sellers may also be forced to cover. That creates extra demand in the short term.
But if the stock cannot stay above the breakout area, the picture changes quickly. The buyers who chased the move are suddenly trapped, and sellers often become more aggressive.
That appears to be what happened with AMZN. After tagging the high near $278.56, the stock failed to hold the breakout and reversed back into the channel. Since then, the weekly candles have turned bearish.
This does not automatically mean AMZN is entering a major downtrend. But it does mean the breakout has lost credibility for now.
Key levels to watch
AMZN has already lost two important levels on the way down.
The first was around $258.60, which acted as a prior shelf. The second was the $242.52 area. The latest weekly close shown on the chart is $232.69, which means price is now below both of those levels.
That puts the focus on the dashed mid-channel support area, near the low of last week.
This is the key battleground now.
If AMZN can hold this area and form a strong reversal candle, the first rebound target would be a retest of $242.52. Above that, the next level to watch is $258.60.
If AMZN loses the mid-channel line cleanly, the chart becomes more vulnerable. In that case, traders may start looking toward the lower half of the channel, with possible support much lower, around the $183-$189 zone.
Two possible paths from here
Bullish case: AMZN defends the mid-channel
For the bullish case to improve, AMZN needs to hold the current support zone and show a clear reaction.
That could come through a weekly reversal candle, a strong close back above $242.52, or several weeks of stabilization near the mid-channel line.
In that scenario, the recent selloff could turn into a normal correction inside a rising channel.
Bearish case: AMZN loses the mid-channel
If AMZN breaks below the dashed mid-channel line and cannot recover it, the failed breakout becomes more serious.
A failed breakout from the top of a channel, followed by a break below the middle of the channel, often points to a deeper mean-reversion move.
That would shift focus toward the lower channel area, with the $183-$189 region becoming a possible longer-term support zone.
Takeaway for traders and investors at Amazon stock
AMZN is at an important weekly decision point.
The stock tried to break out, failed, and has now pulled back to the middle of its rising channel. That makes the next few candles especially important.
A strong defense here could set up a bounce toward $242.52 and possibly $258.60. A clean breakdown would increase the risk of a deeper move toward the lower part of the channel.
For now, this is not a clean buy-the-breakout setup anymore. It is a support test after a failed breakout. That calls for patience, not chasing.
This analysis is for educational purposes only and is not financial advice. Always do your own research and trade at your own risk.