XRP News: XRP price touched $1.15 on June 4, 2026, its lowest print in four months, shedding roughly 20% from the $1.50–$1.60 range where it had repeatedly stalled through May and wiping more than $10 billion from its market capitalization in a matter of days.
The move triggered approximately $30 million in liquidations from leveraged traders, per available derivatives data, and was sufficient to push XRP’s market cap below $75 billionm, allowing USDC to overtake it as the fifth-largest cryptocurrency by that metric, according to CoinGecko rankings.
The analytical question is no longer whether XRP failed to break out; it is whether the institutional bid that supported price above $1.30 since the 2024 U.S. presidential elections has now structurally withdrawn, or whether this is a flow-driven flush that leaves the asset cheap relative to its network fundamentals.
XRP News: ETF Inflow Reversal and the Transmission Mechanism Behind the Drop
The clearest causal thread in this sell-off runs through institutional product flows. XRP-linked spot ETFs sustained their longest net inflow streak of 2026 through late April, a dynamic that helped defend the $1.40 level as a structural floor.
That streak ended on April 30, and the absence of net inflows on May 1 marked the first session in weeks where marginal institutional demand was not present to absorb spot selling – a configuration that, in hindsight, shifted $1.40 from support to resistance within days.
What the flow news does not prove is that institutions are rotating out of XRP permanently; it shows only that the pace of inflows was insufficient to counter the broader risk-off sentiment sweeping the crypto market as macro traders repriced Federal Reserve rate-cut expectations following stronger-than-expected U.S. labor data in early June.
The structural paradox worth examining is that XRP ETF assets under management reportedly hit new all-time highs in May even as the spot price remained range-bound near $1.43, moving less than 1% week-over-week.
Growing product size alongside flat price suggests inflows were no longer outpacing the broader selling pressure – a form of basis compression that, historically, tends to precede something, not nothing.
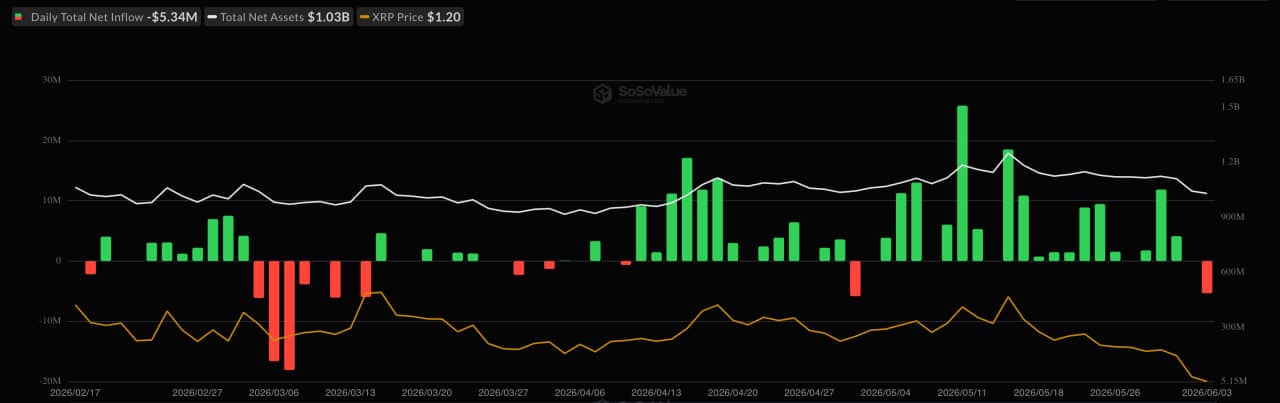
Source: SoSoValue
Meanwhile, XRP sentiment metrics had already deteriorated to multi-week lows even before the June 2 breakdown, with social volume and crowd ratio readings that Santiment had flagged as capitulation-adjacent – a reminder that soft retail demand and stalling institutional inflows can coexist for weeks before price adjusts sharply to clear the imbalance.
On the network side, active XRP Ledger addresses had surged to a five-week high of 46,767 in mid-May, coinciding with XRP briefly touching $1.55 before being rejected, a divergence between rising on-chain usage and capped price that in hindsight underlined the severity of sell pressure at higher levels. Positively, Ripple’s RLUSD expansion into new liquidity corridors represents the kind of fundamental development that has historically attracted institutional re-engagement – but such catalysts require a stabilized macro backdrop to convert into sustained spot demand.
EXPLORE: Crypto breakout alerts this week
XRP Price Structure: Support Levels, Failed Breakout Zone, and What Reclaim of $1.40 Would Signal
From a technical standpoint, the $1.20 low sits approximately 8% above the early-February 2026 flash-crash low of just over $1.10, which currently represents the most proximate structural floor with prior price memory.
Analyst Ali Martinez flagged a breakdown from a rising trend-line symmetrical triangle as the triggering pattern, projecting a continuation toward approximately $1.14, a level that would constitute a retest of the February floor and, if breached on a daily close, would leave no meaningful chart support until the sub-$1.00 area last defended in late 2024.
The $1.30 level, which had held as a floor continuously since before the U.S. elections, has now been definitively broken, reclassifying it as near-term resistance rather than support.
ripple:native keeps marching toward my $1.14 target following the breakout from a symmetrical triangle. https://t.co/QVPCjMEKou pic.twitter.com/cpbZs1H2CY
— Ali Charts (@alicharts) June 2, 2026
On the upside, the $1.40–$1.45 band is the first zone where any recovery attempt is likely to encounter meaningful supply, given that it served as the equilibrium range for much of May before the ETF inflow reversal.
A sustained daily close above $1.45 would be required to signal that the breakdown is corrective rather than structural, and would need to be accompanied by a resumption of net positive flows in institutional crypto products tracking XRP.
Volume during Monday’s decline was elevated relative to the prior two weeks, consistent with a liquidation cascade rather than orderly distribution, a distinction that matters for interpreting whether the move has fully exhausted forced selling or whether a secondary wave remains possible if $1.14 fails to hold.
DISCOVER: Meme coin supercycle: Top performers this week
Disclaimer: Coinspeaker is committed to providing unbiased and transparent reporting. This article aims to deliver accurate and timely information but should not be taken as financial or investment advice. Since market conditions can change rapidly, we encourage you to verify information on your own and consult with a professional before making any decisions based on this content.

Daniel Frances is a technical writer and Web3 educator specializing in macroeconomics and DeFi mechanics. A crypto native since 2017, Daniel leverages his background in on-chain analytics to author evidence-based reports and deep-dive guides. He holds certifications from The Blockchain Council, and is dedicated to providing “information gain” that cuts through market hype to find real-world blockchain utility.